Process Book for Project Data at Large
Internet has become an integral part of modern life. As we take advantage of the conveniences that the digital age offers,
we are becoming increasingly vulnerable to cybercrimes such as fraud and identity theft. Inspired by the recent data breach
incident from Equinfax that affected over 143 million people in the United States and a
visualization of company data breach cases, we would like to investigate and understand
the increasingly serious issues with data breaches, use visualizations to raise the public’s awareness in monitoring the safety
of their personal data, and offer approaches in cybersecurity protection.
The project is consisted of 4 main parts: We begin by describing the rise of the Internet age and transitioning to a
brief background of hackers and why they hack. Subsequently, we show selected incidents of company data breaches to make the
point that the data we implicitly entrust to companies are susceptible to cyberattacks. The consequences of these data breaches
are often cybercrimes on an individual level, so we follow up by visualizing identity theft trends and the time needed to resolve
it. Lastly, we aim to make suggestions on creating a safer online existence.
The main goal of this project is to use visualizations to raise the public’s awareness in monitoring the safety
of their personal data, and offer recommendations in cybersecurity protection. To do so, we would like to explore the
following questions:
All of our data sources are listed in the main website. Here, we re-present data sources as they relate to our project sections.
Here, we present the design evolution of each of our 10 visualizations, which were grouped into 6 composite visualizations. As you will see, most visualizations underwent drastic re-designs with the intention to achieve a balance between story telling and visual effect.
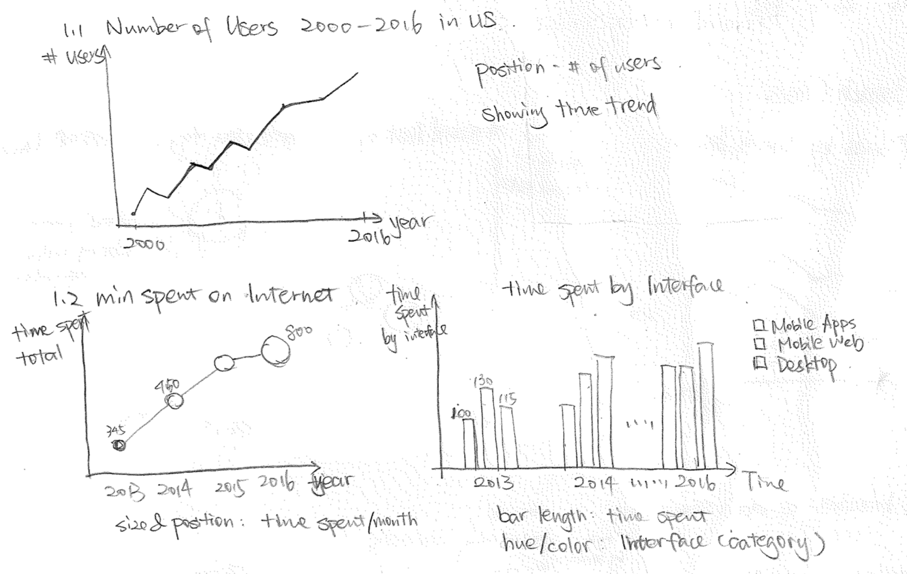
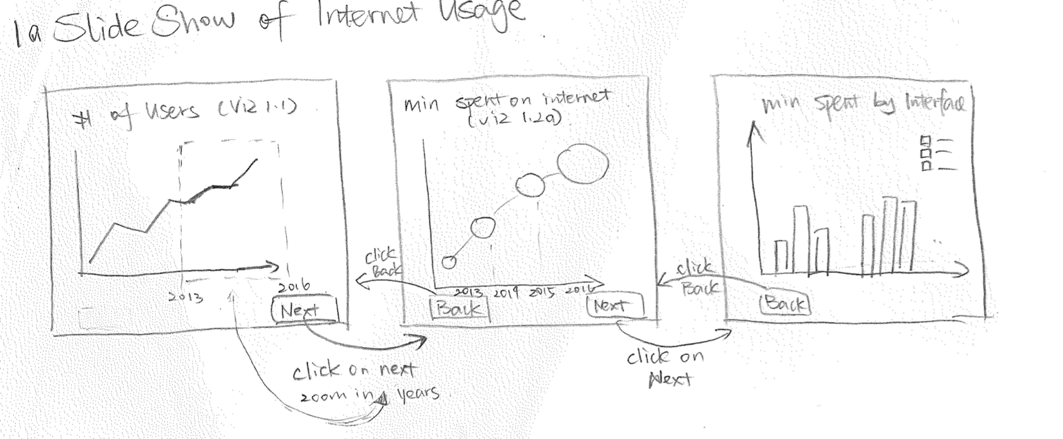
The major point we wanted to make with this visualization is that internet had taken over the world very quickly since its commercialization in 1995. In the initial design, we hoped to achieve this by using a set of graphs that displayed the trend from different perspectives. We imagined that we would use a slide show format to deliver these graphs visually.
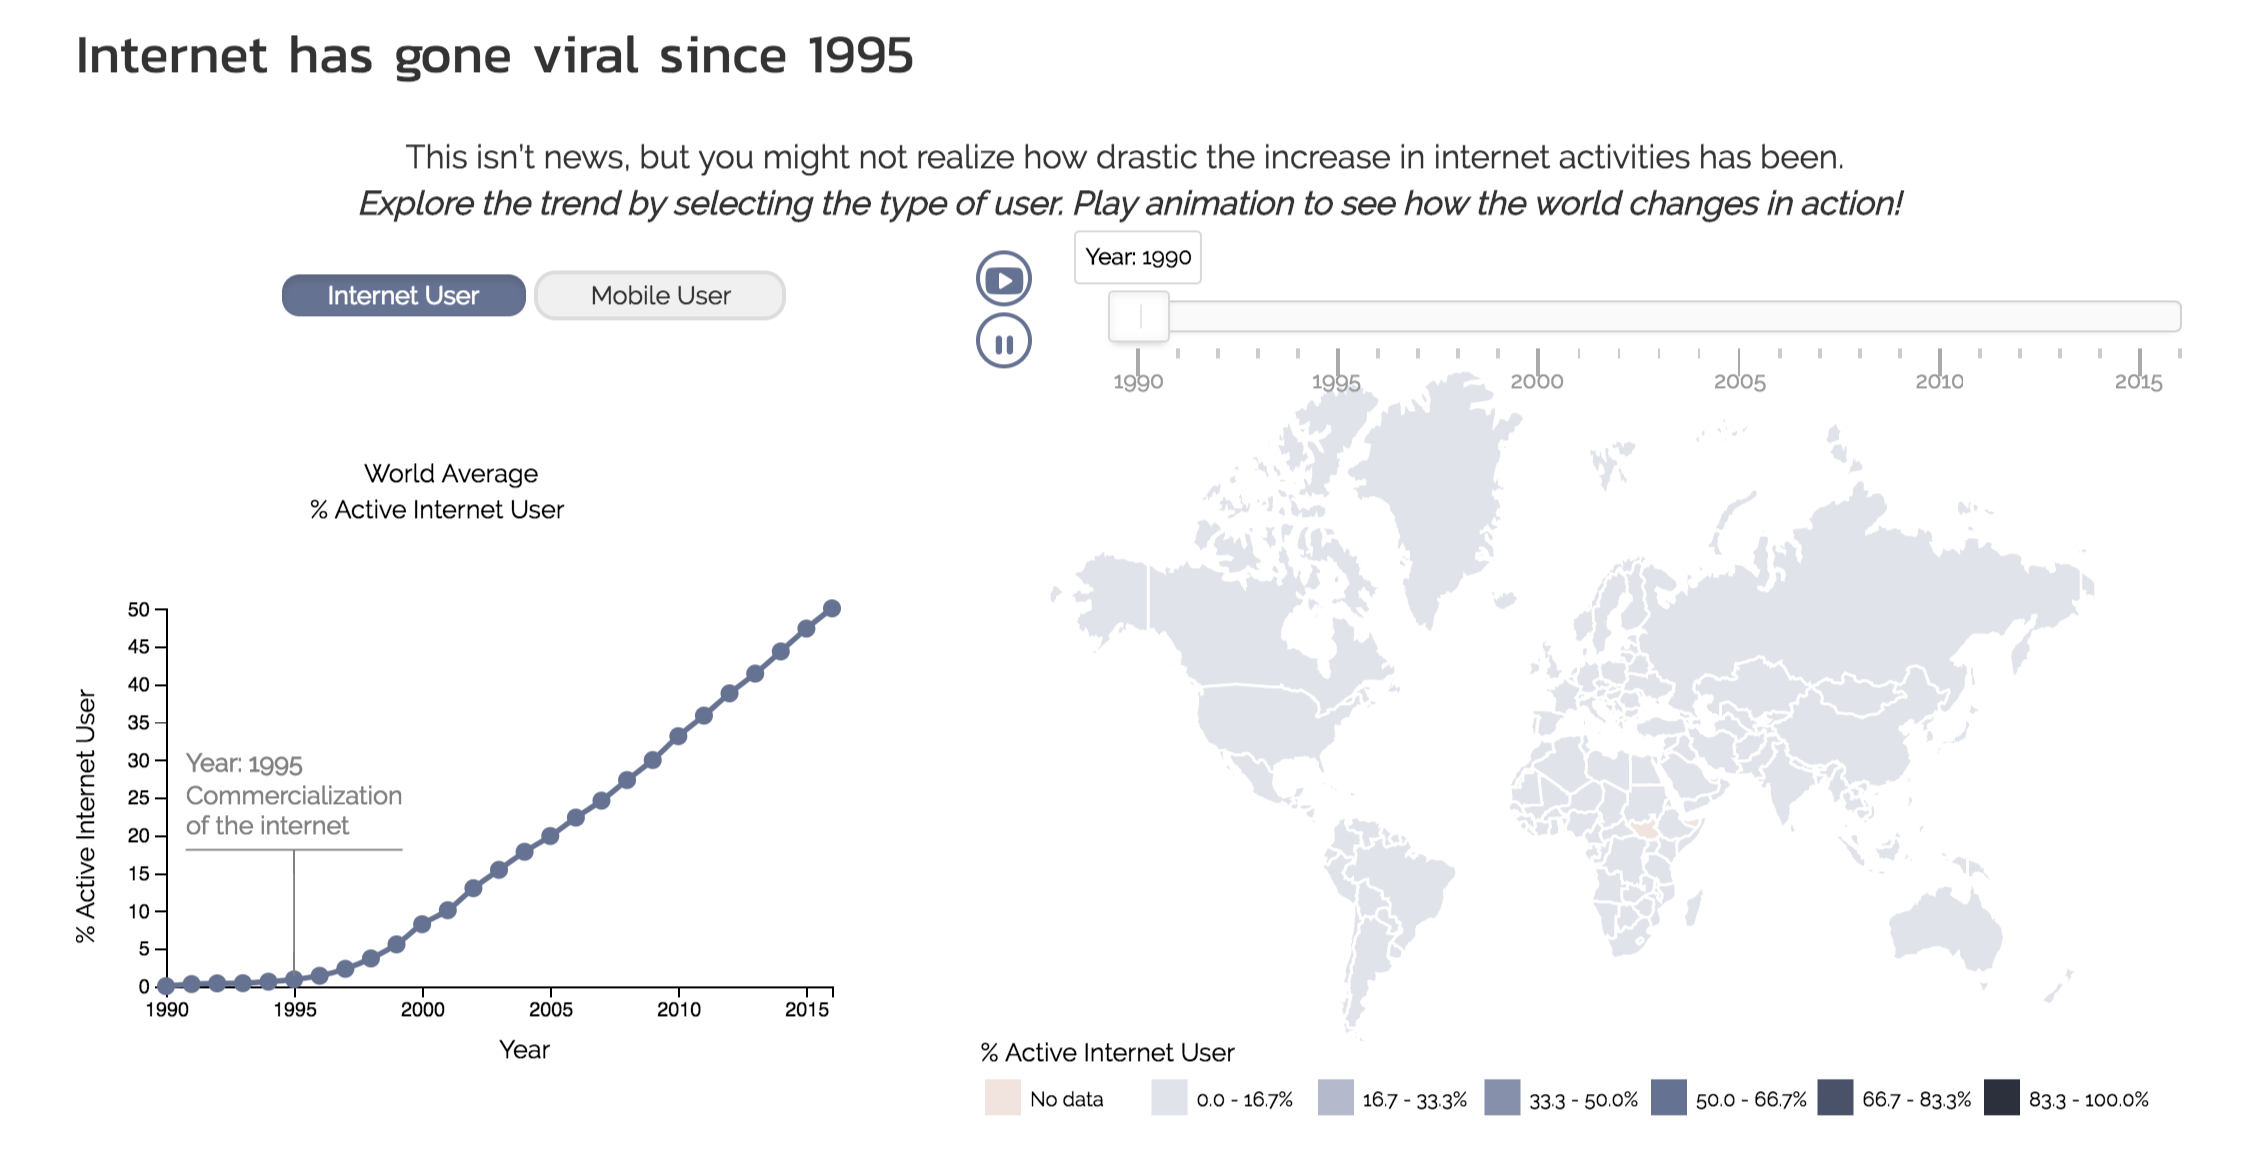
We felt that the initial design, while capable of conveying our point that internet usage had grown tremendously, line and bar charts are not very eye-catching, especially serving as the very first visualization of the project. Therefore, we gathered additional data from the Wrold Data Bank in order to be able to plot a choropleth. We also enabled more interactivity by introducing animation and buttons to switch views. The linear growth in the line chart, coupled with the darkening map, tell a much more attention-grabbing story than the previous design.
This is one of the visualizations for which we not only changed the design, but we completely changed the content. Originally, the designed story flow was to visualize various online activities and compare their potential for exposing the user to cybersecurity threats. The design sketch is shown below.
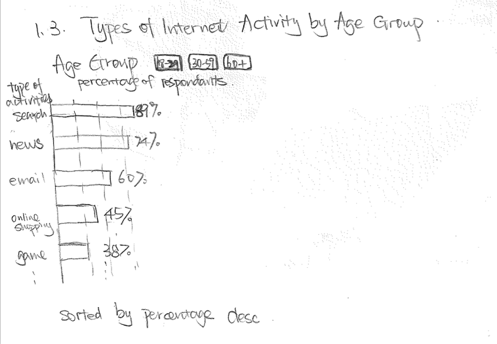
After having implemented the bar charts, we felt that a plain bar chart was not a very exciting visual transition. Fortunately, we came across a hackers survey that we found interesting and informative. We thought giving some insights into why and how hackers came to be would be a better transition to discussing cybersecurity issues since we wouldn't be nearly as worried about cybersecurity if there weren't any hackers.
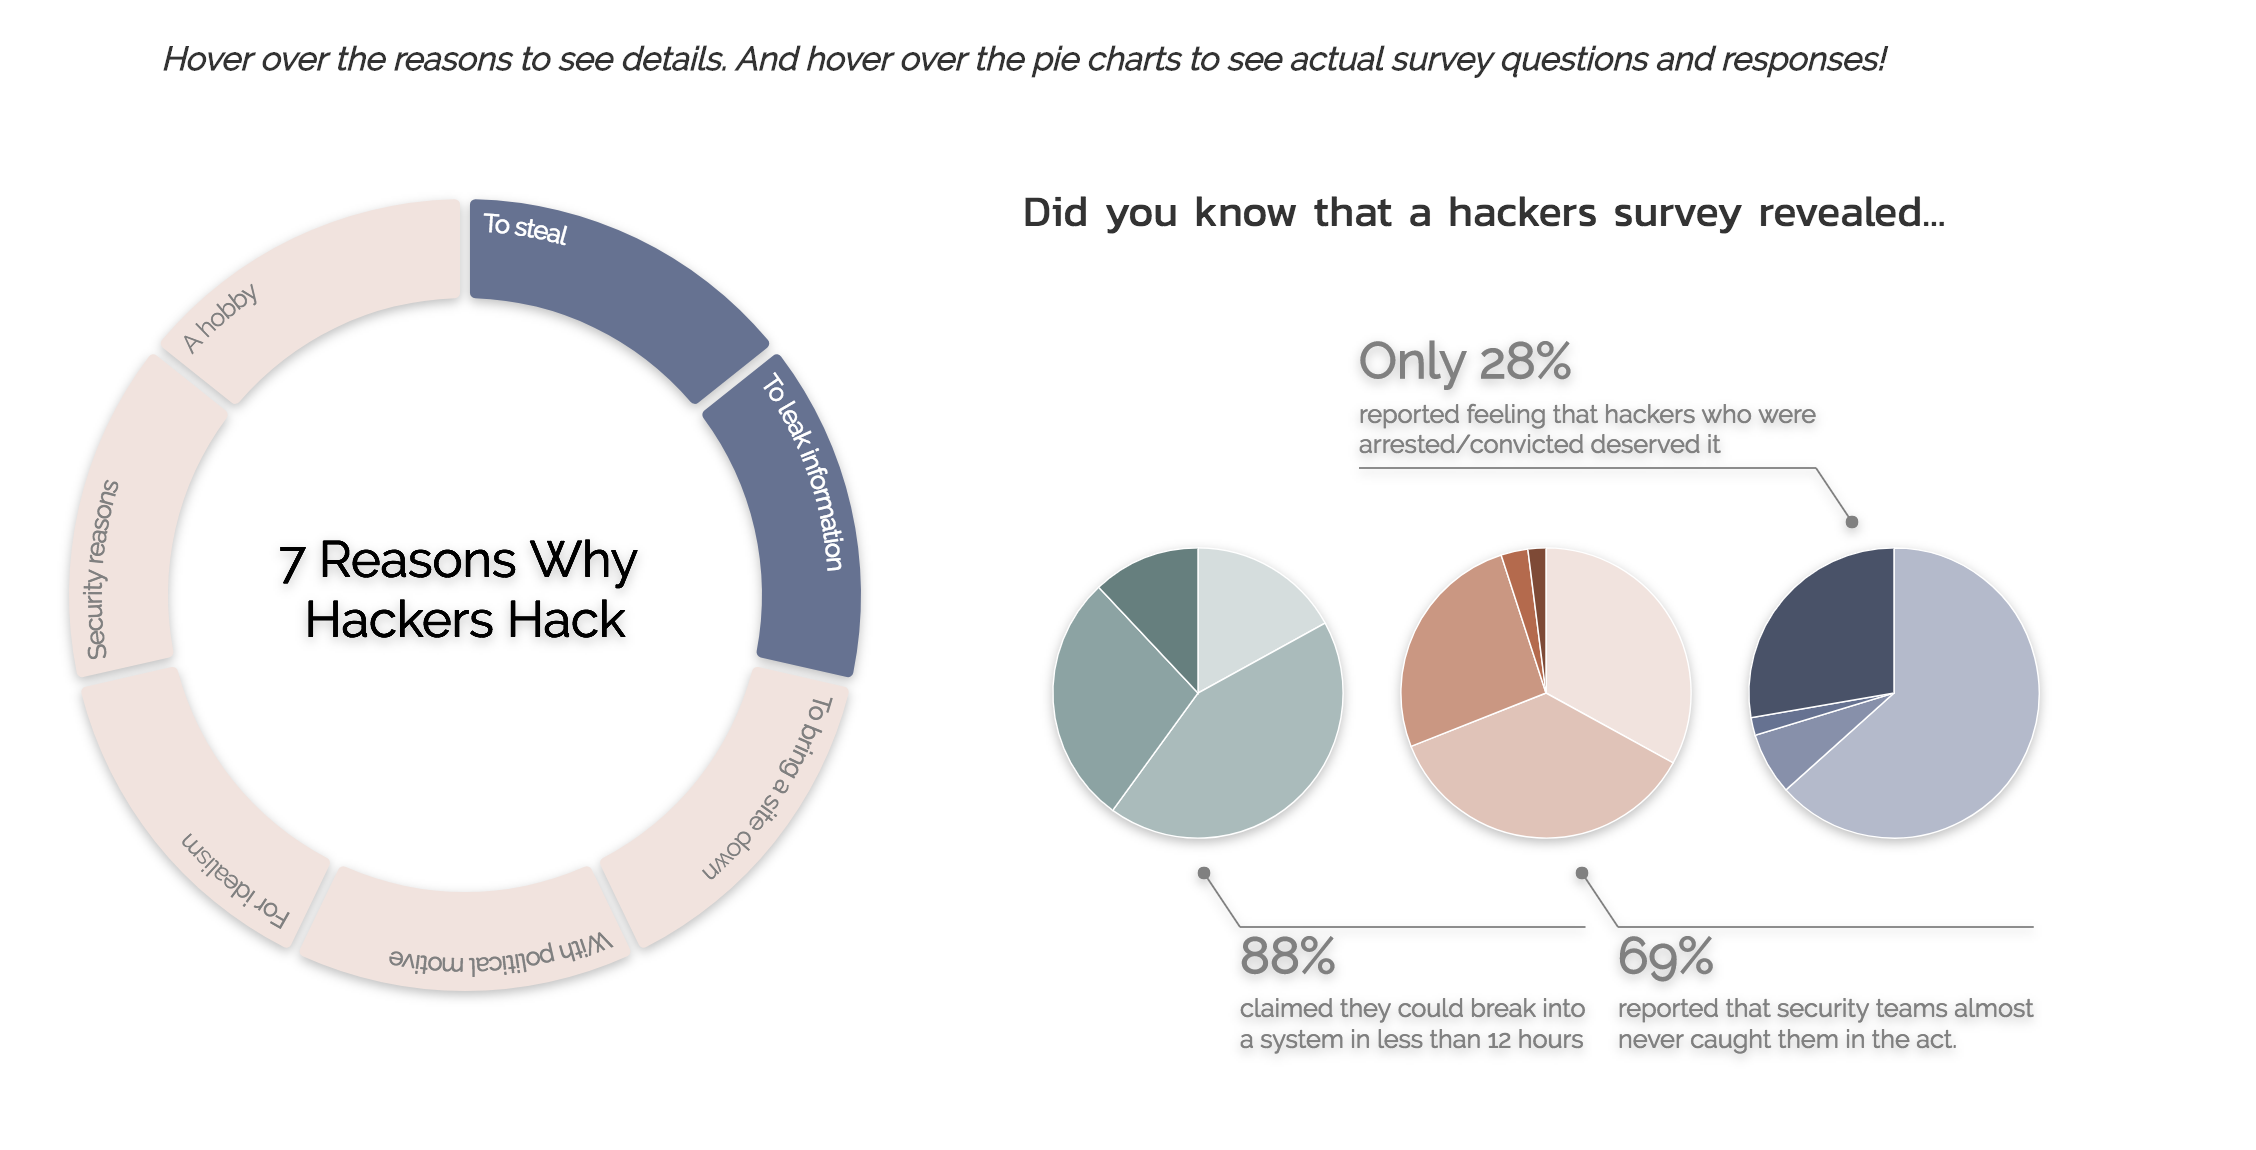
This design allows the user to hover over the reasons donut chart to read more about the reasons why
hackers hack. It also allows the user to hover over the pie charts to see the results of 3 interesting
survey questions that revealed just how easy it is for hackers to hack into a system and how most hackers feel sympathetic/
empathetic to other hackers who have been arrested.
One problem with this design is the coloring of the pie charts. Each color represents one category of response
from the survey, but the color scheme overall does not reflect the message in the annotations.
For instance, the annotation, 88% of hackers can break into a system in less than 12 hours,
reflects the sum of 3 answers (0-2 hours, 2-6 hours and 6-12 hours). Therefore,
we decided to color the pie charts to match the message rather than simply color each response with a different shade. This resulted
in the final design as shown below.
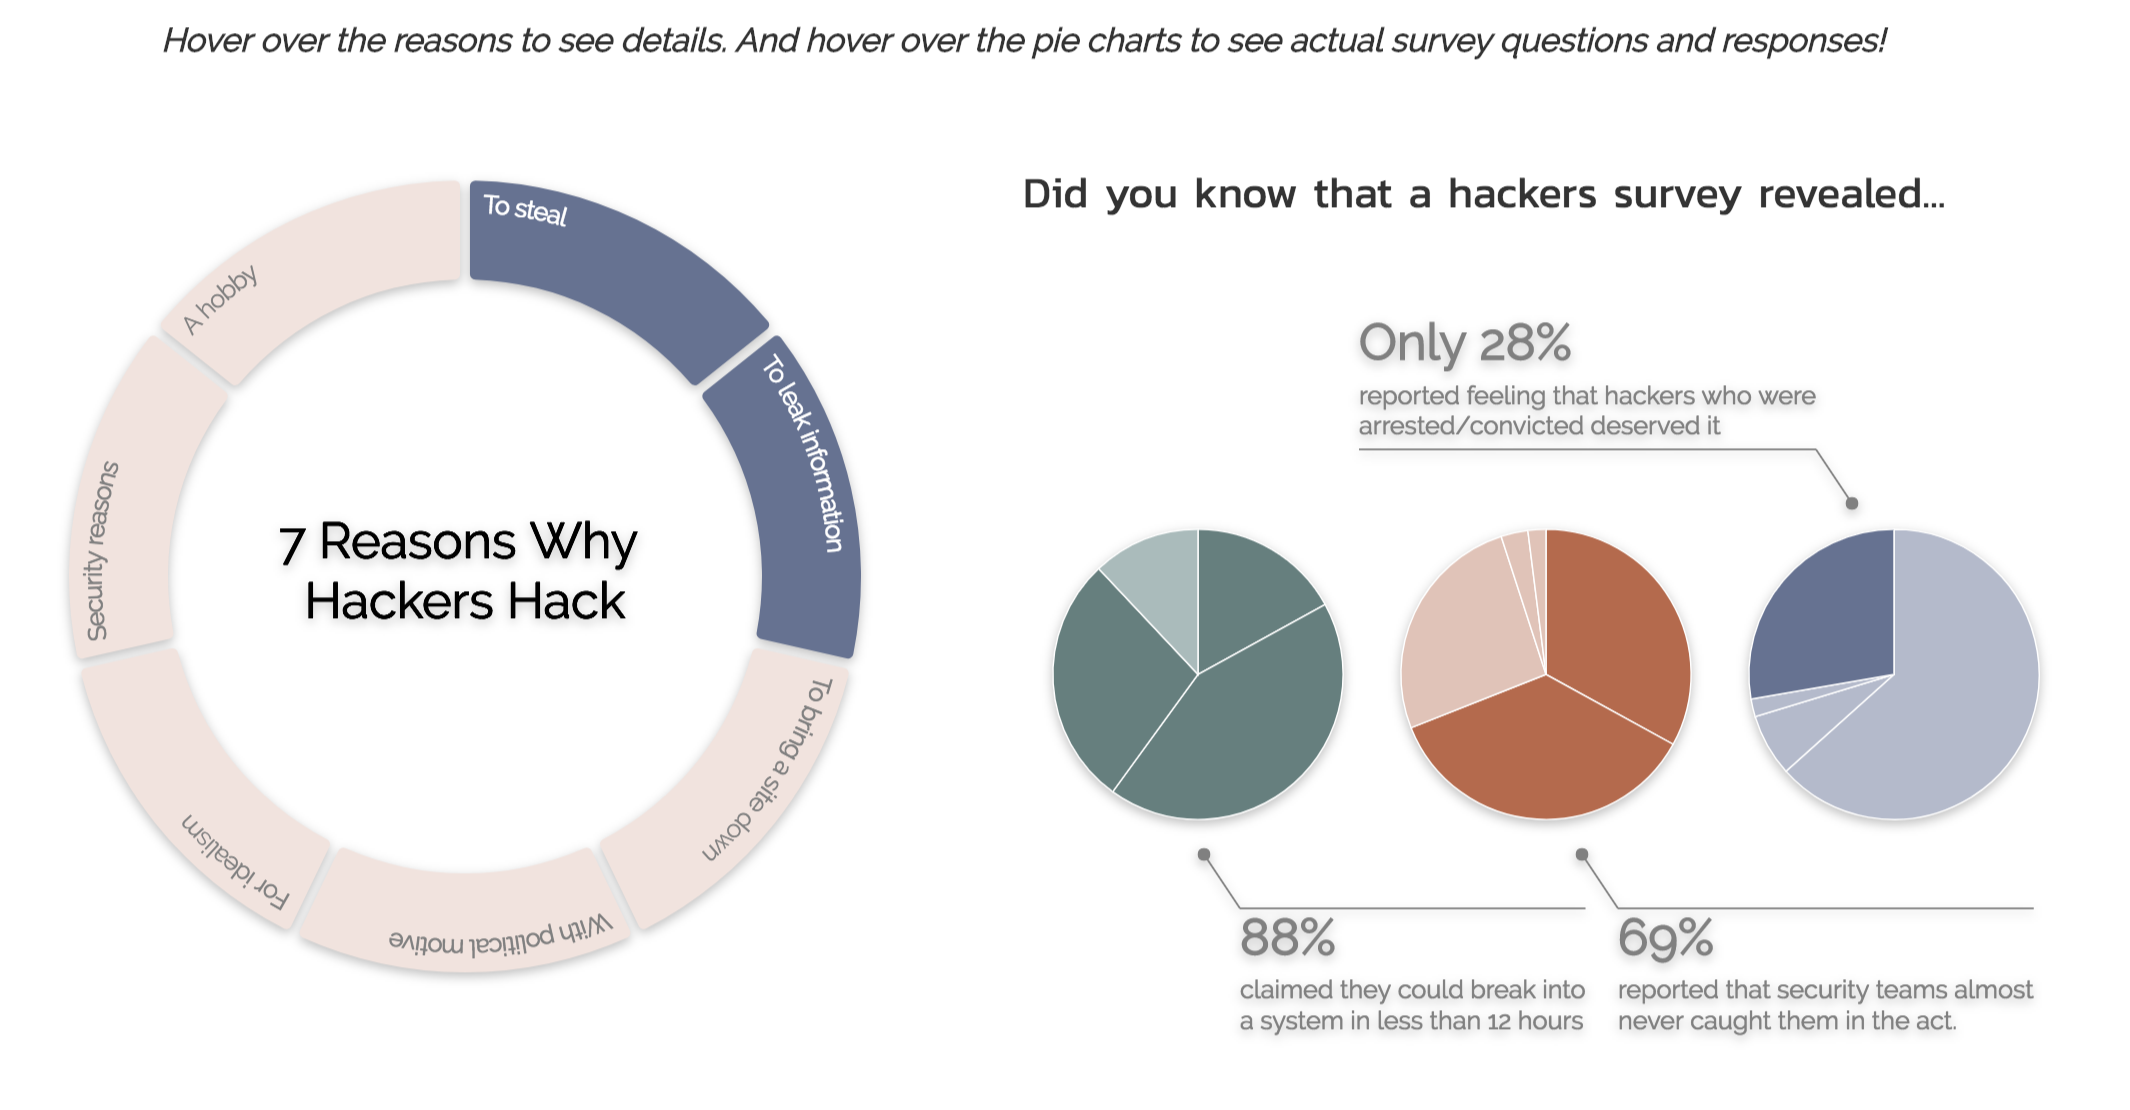
In the final design, we also animated the appearance of the charts and annotations to direct viewer attention to the relevant elements.
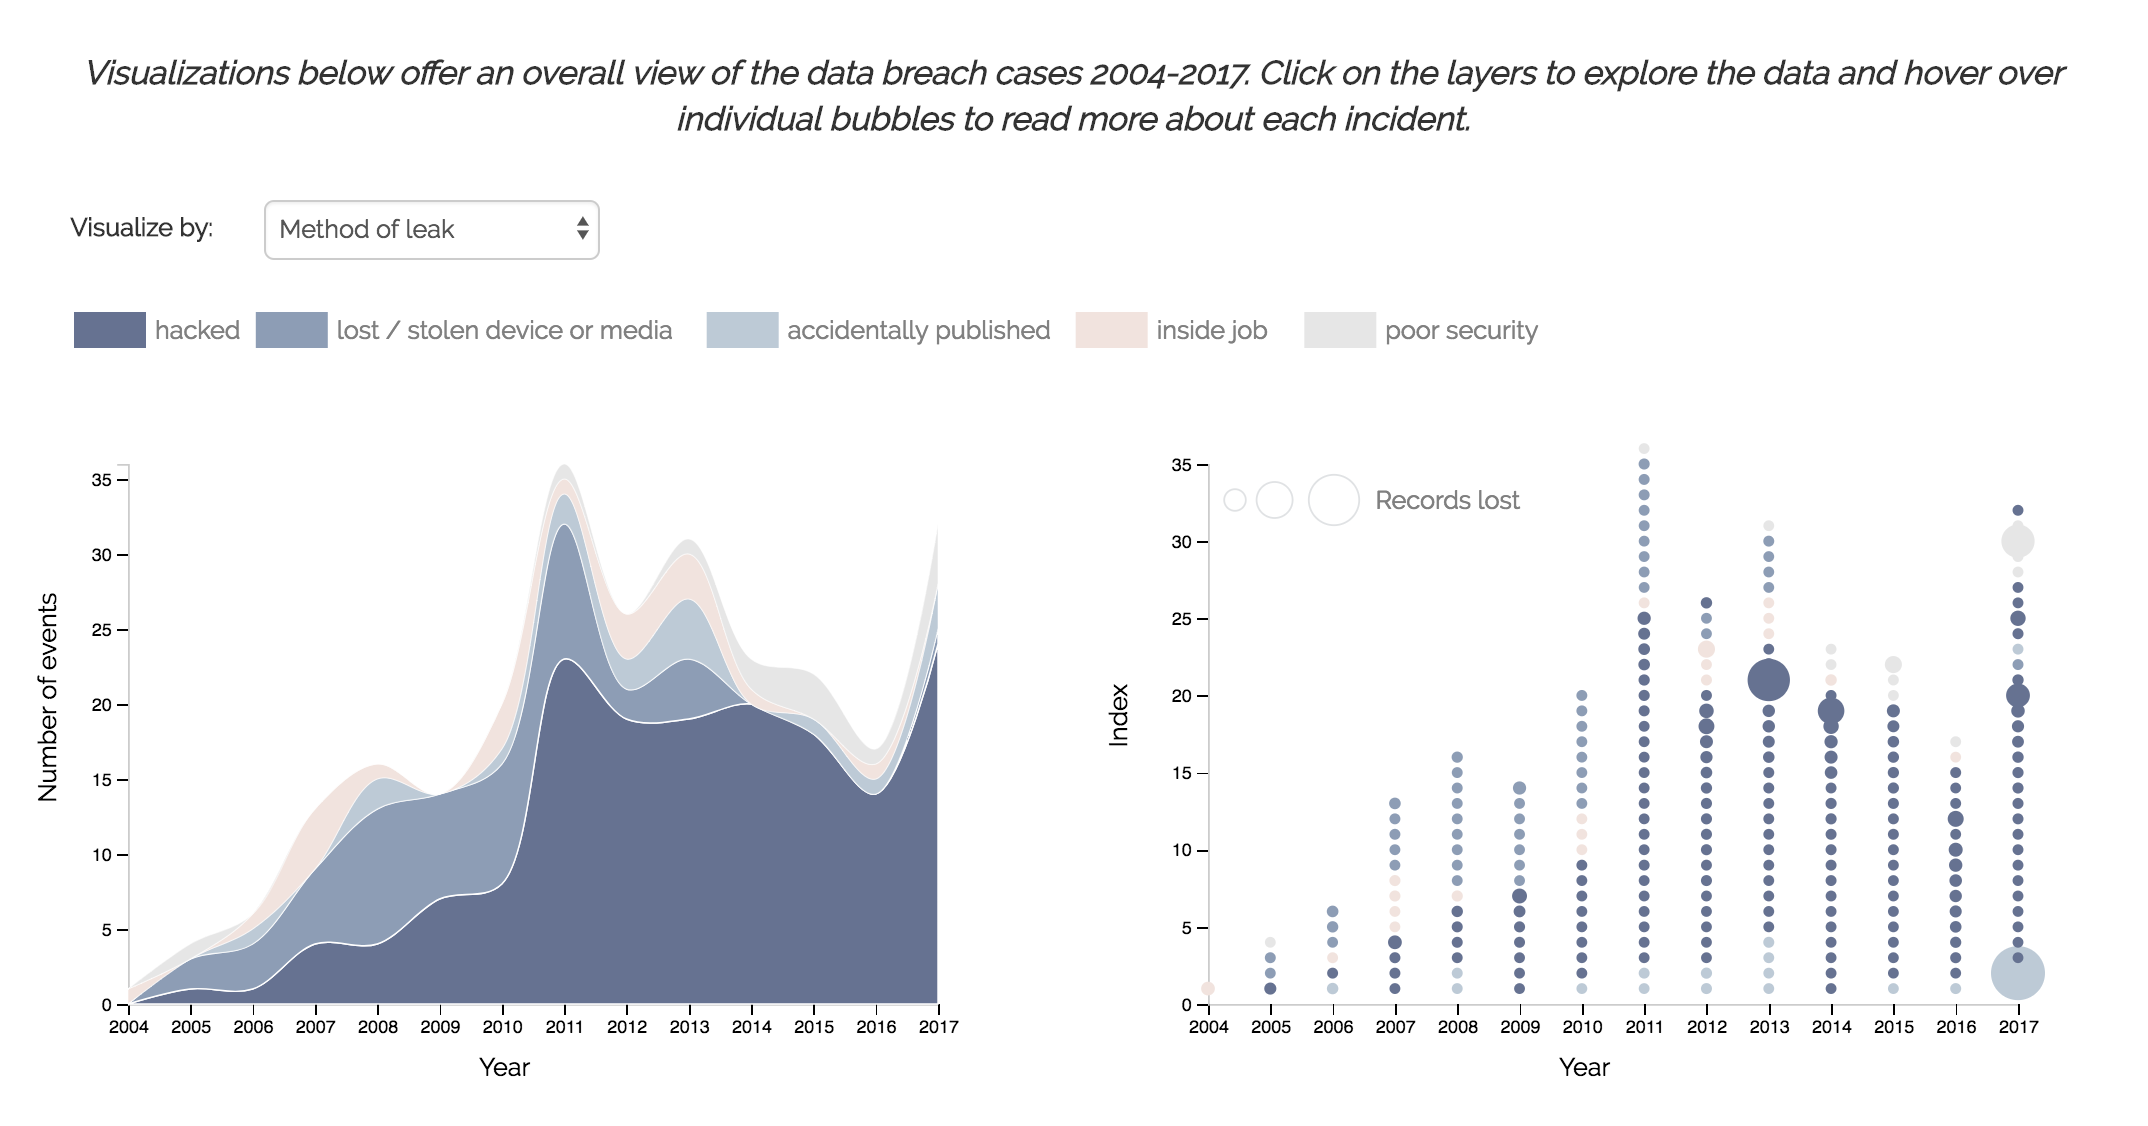
The goal of this visualization is to visualize the overall trend of data breach cases and also allow more detailed cross-sectional views of the cases by clicking certain area of the stacked area chart, or referring to the bubble chart in the right.
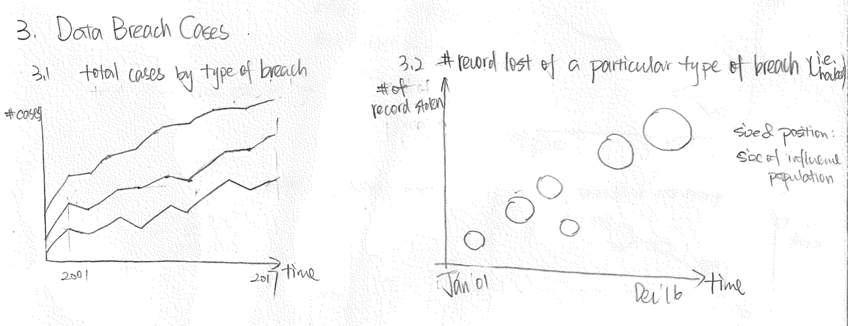
We preserved most of the decisions made in the initial design, with only a few tweaks. As we developed the visualization, we realized that in the bubble chart, the variables which are mapped to the y-axis and size, actually have the same values in the data. Essentially, we only have one dimension to visualize. We tackled this problem by modifying the y-axis to the index of individual breach cases. So essentially we are stacking breach cases into pillars, with the size of the circle indicating the severity of the breach.
The interactivity also worked as expected. When an area in the stacked area chart is clicked, the bubble chart filters accordingly to show only the selected category. Both charts are able to listen to the "visualize by" drop-down selection to view different variables.
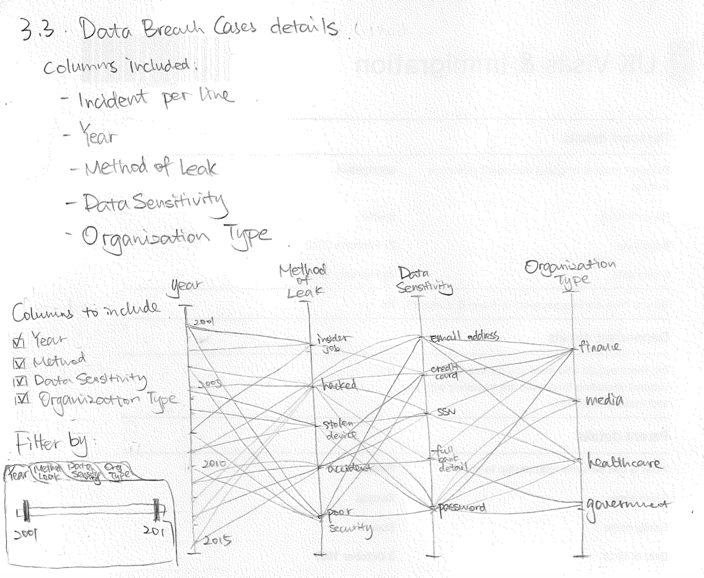
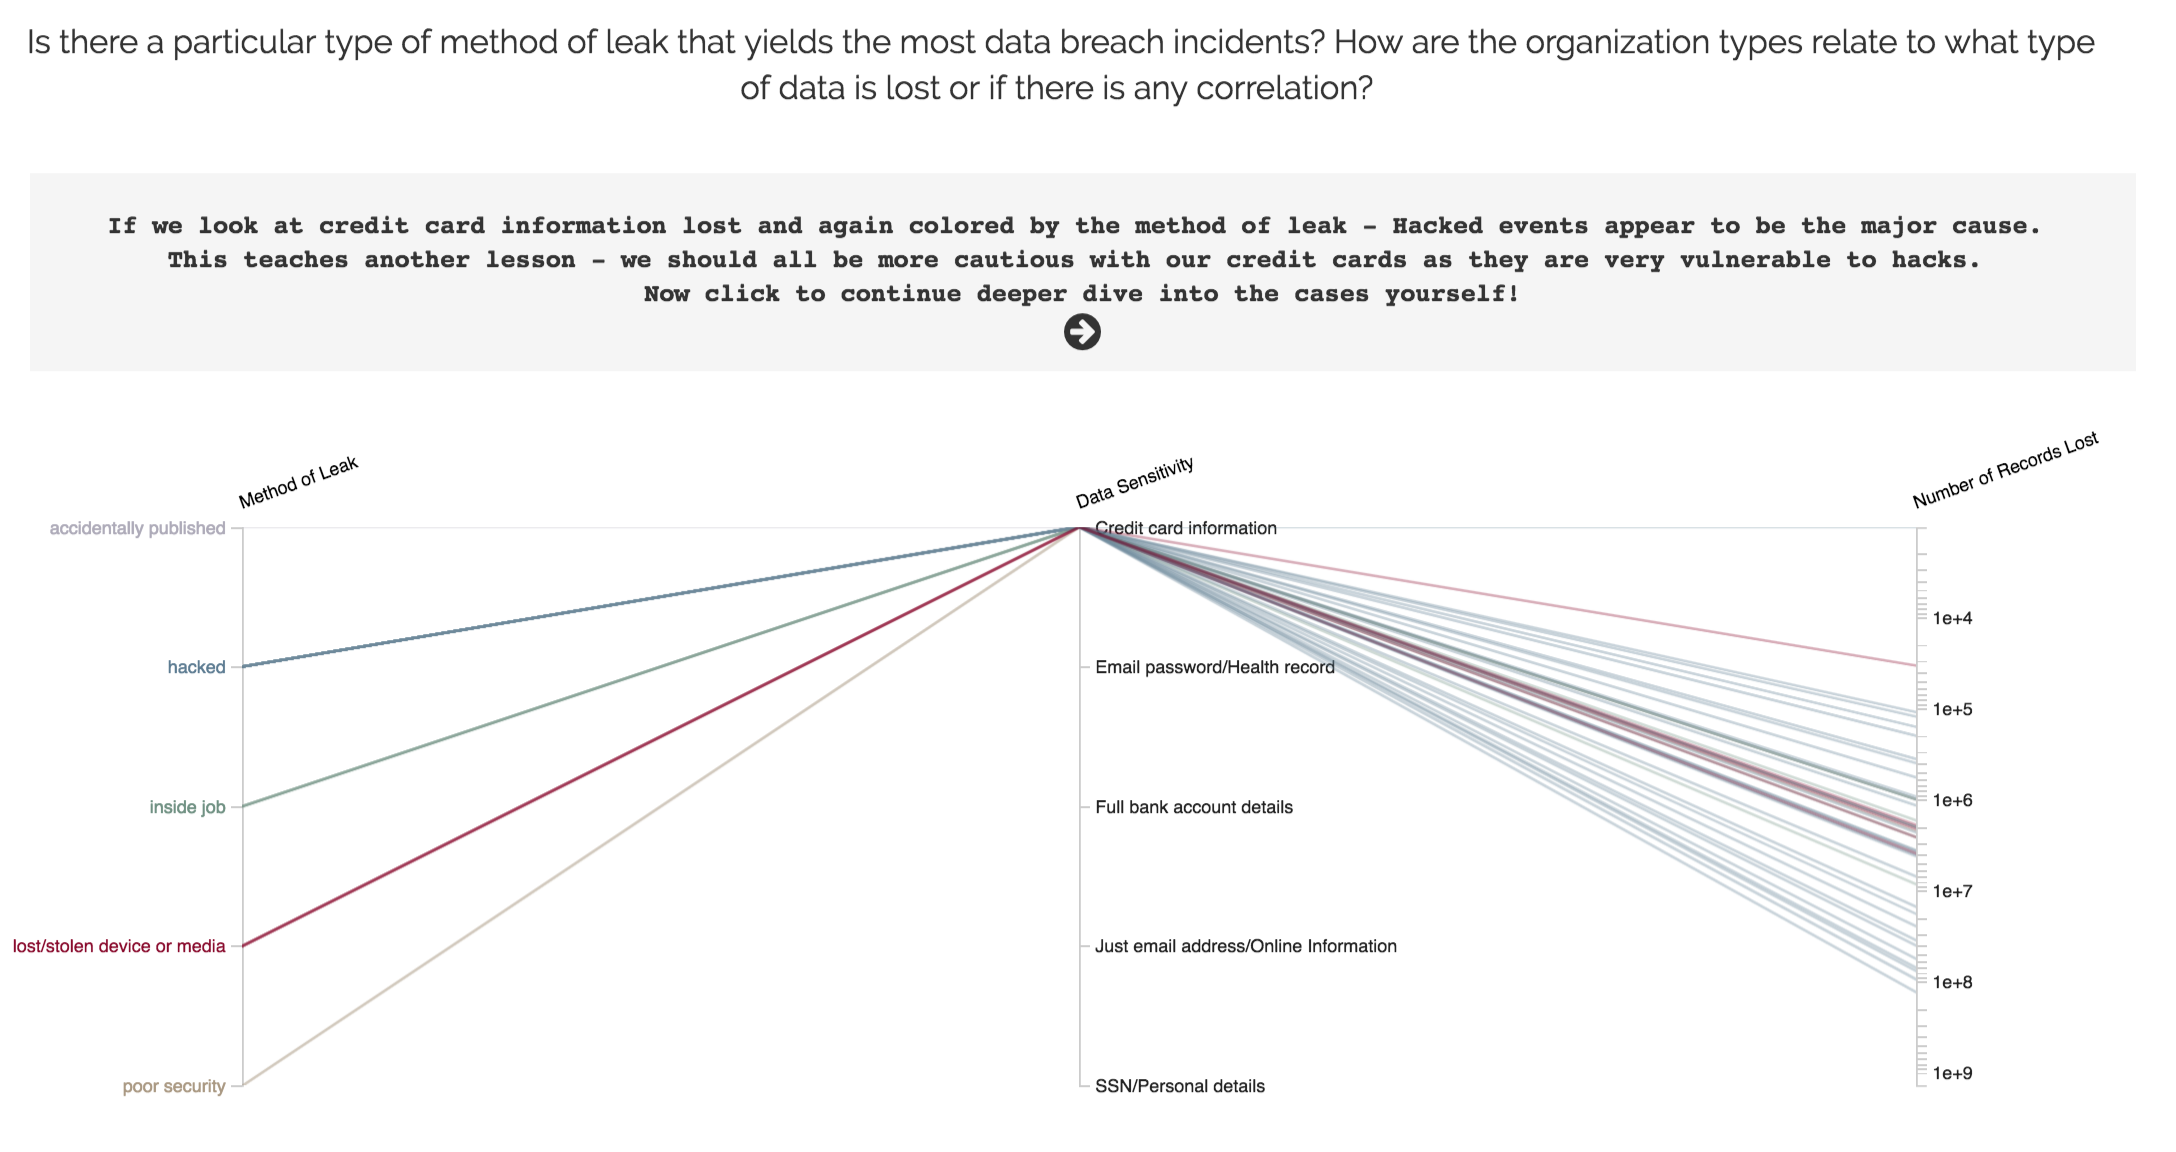
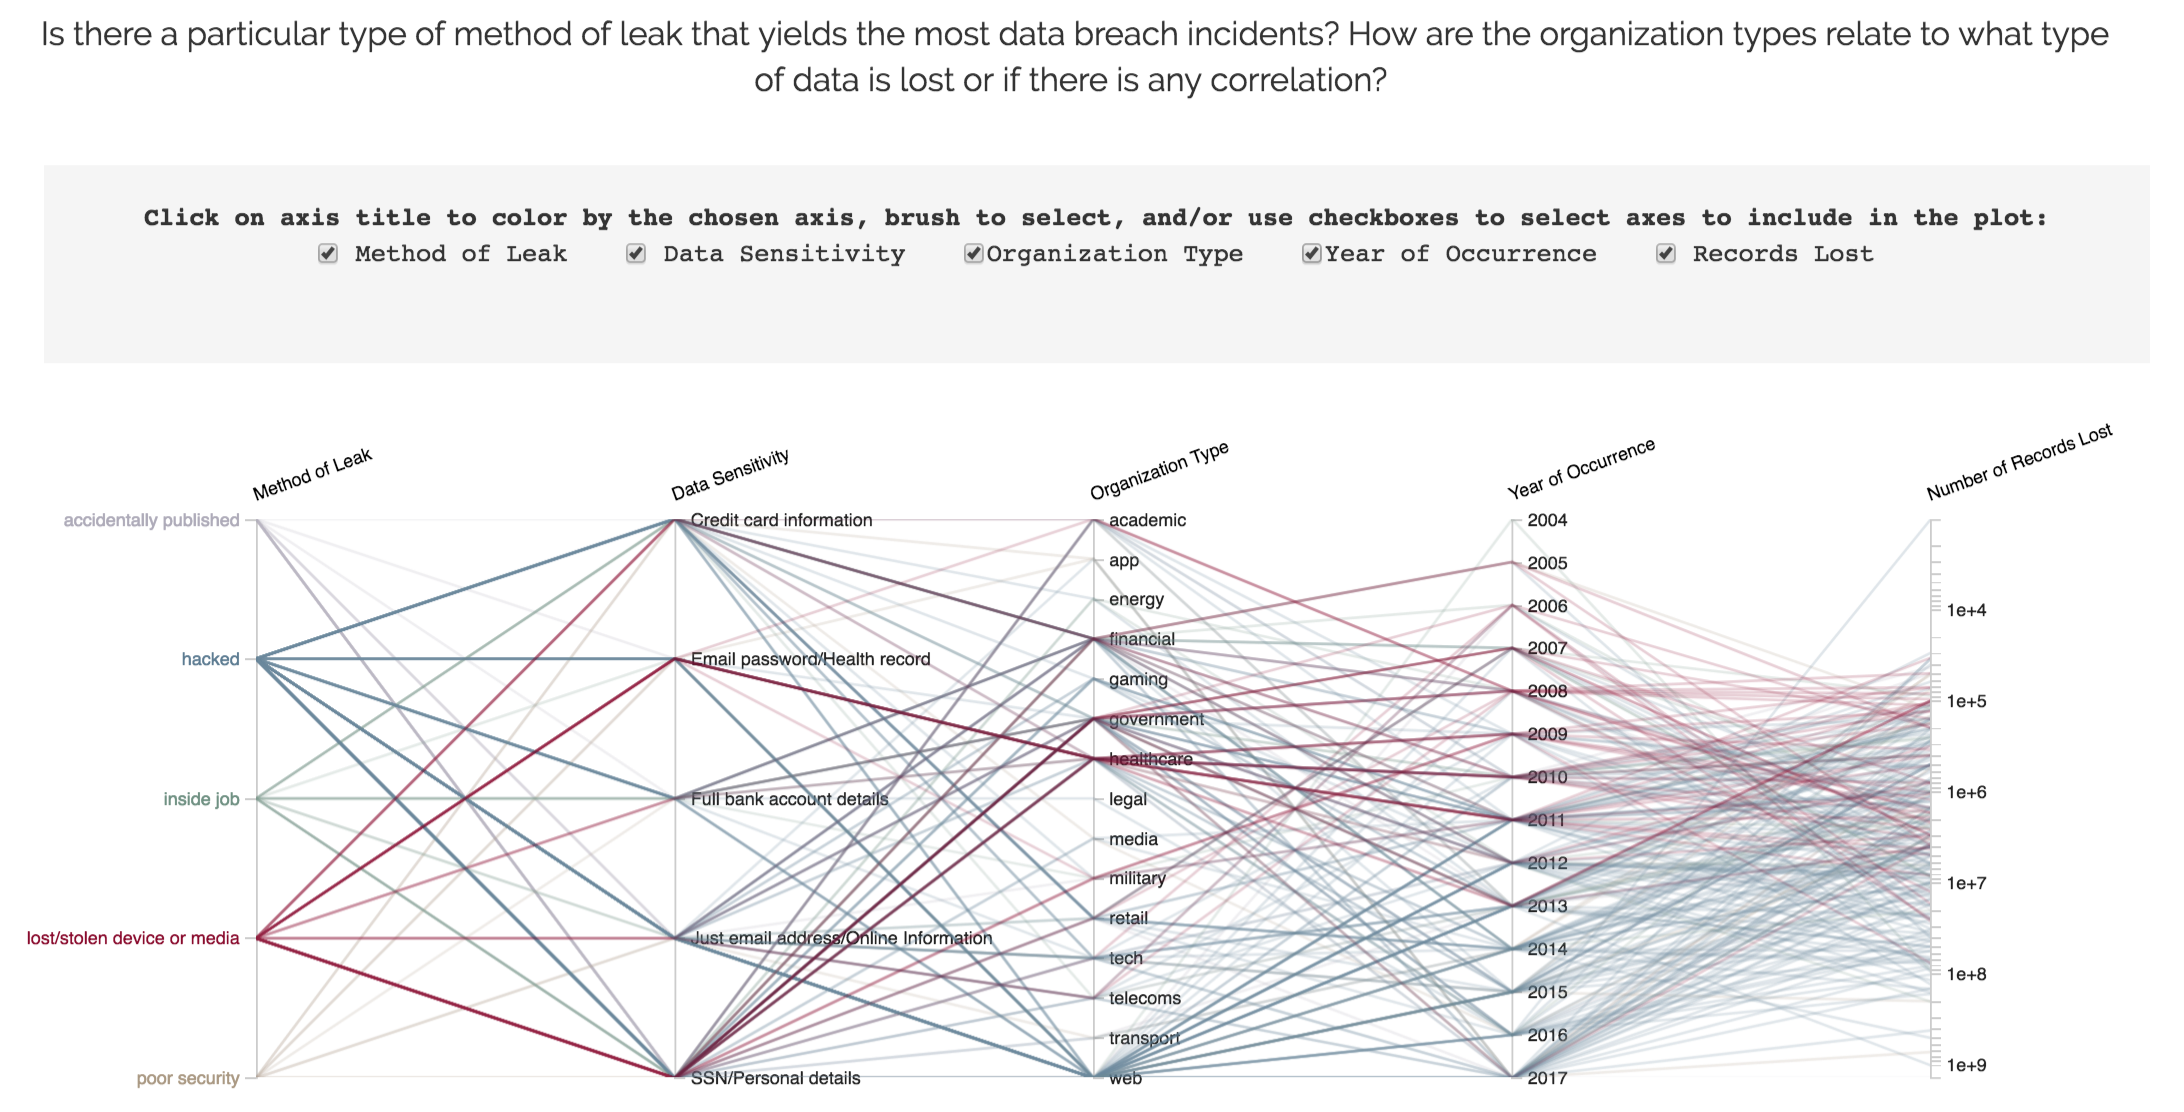
This chart uses the same data as Visualization 3, but it presents the data in a fundamentally different way. The goal of this visualization is to allow the viewers to dive in the dataset and uncover their own understanding. A parallel coordinate chart is a great way for this purpose. Our design allows the viewer to specify the axes, color by different axes and brush on individual axis to filter observations.
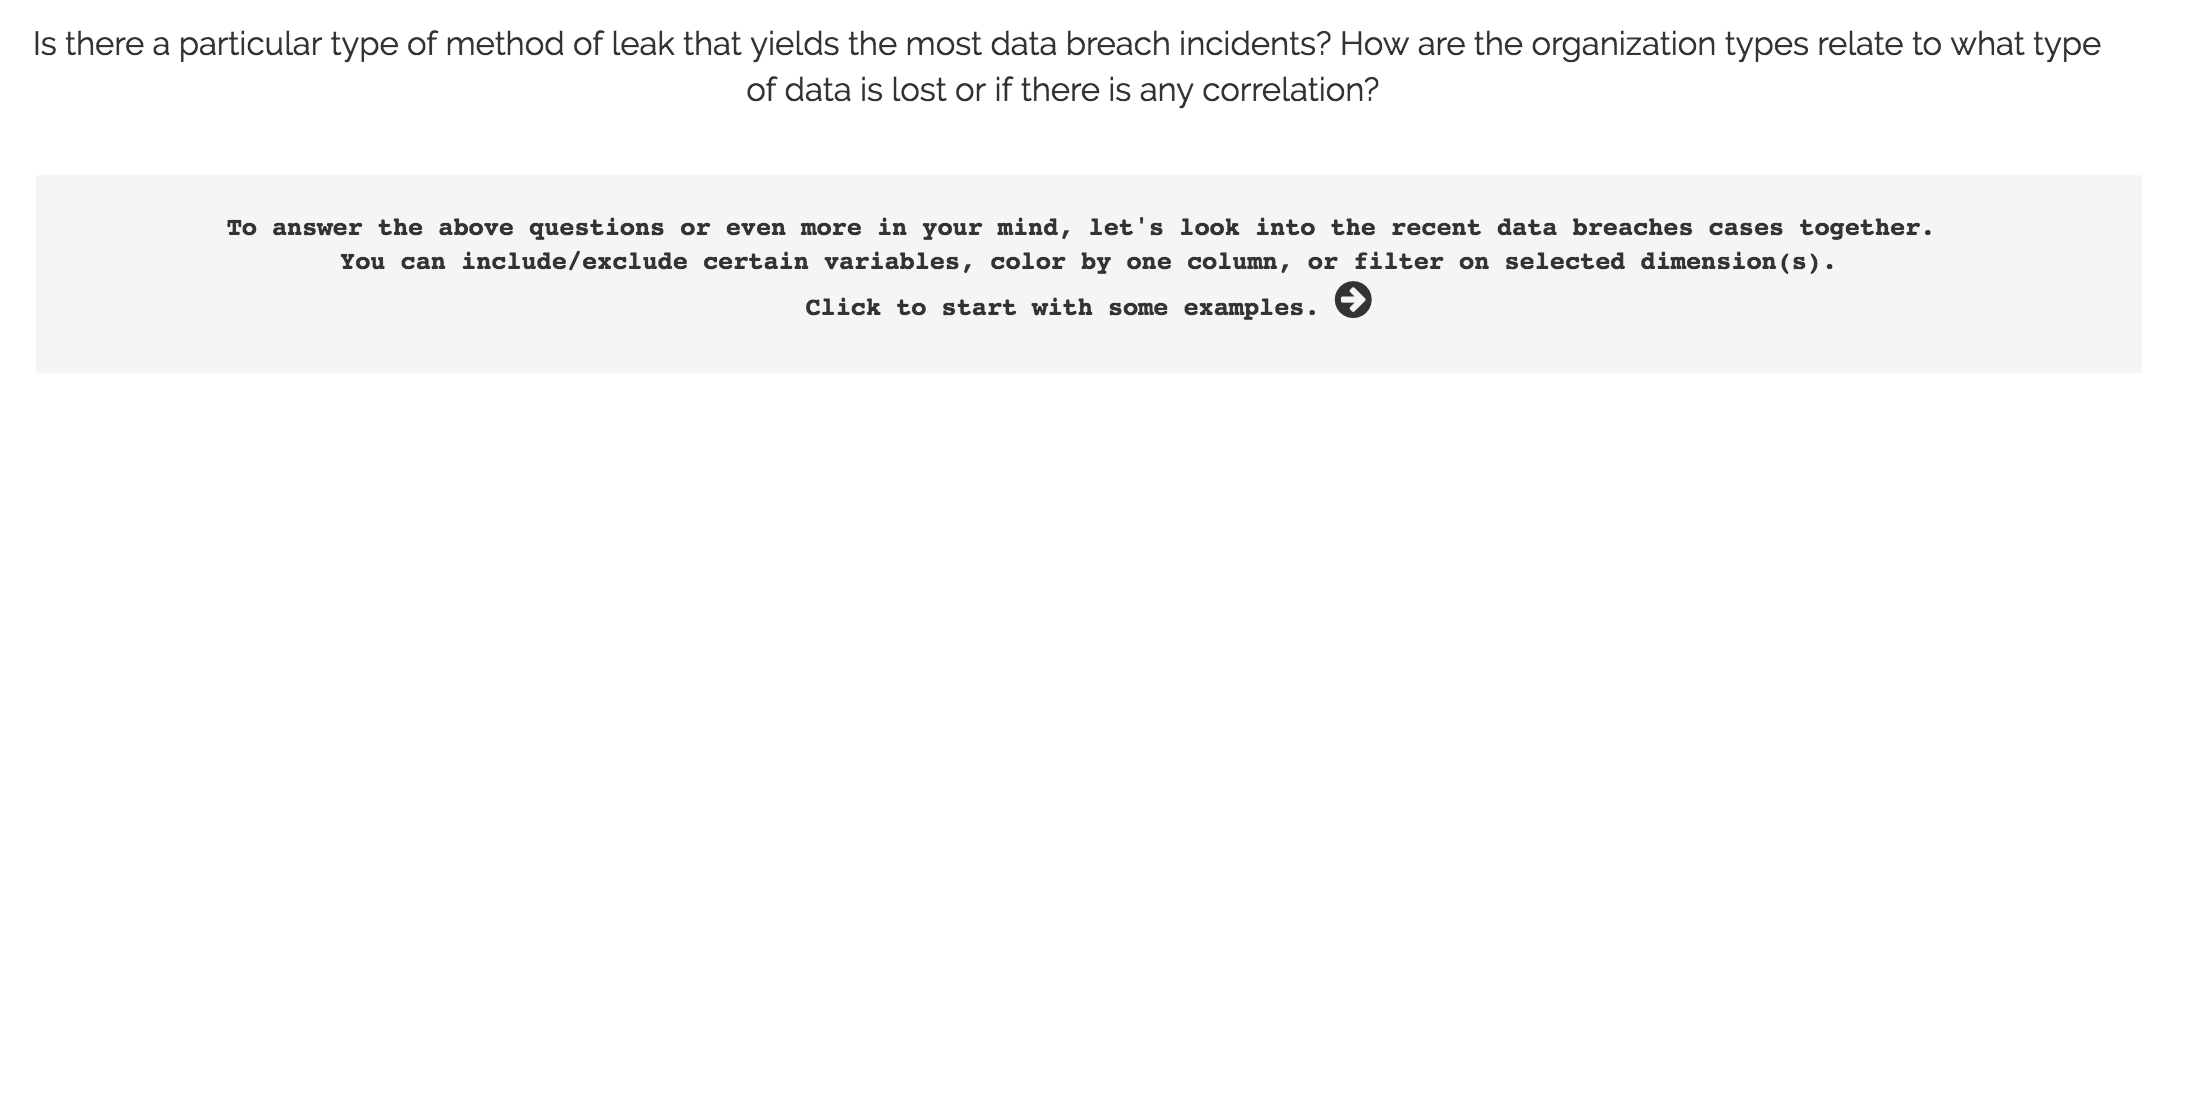
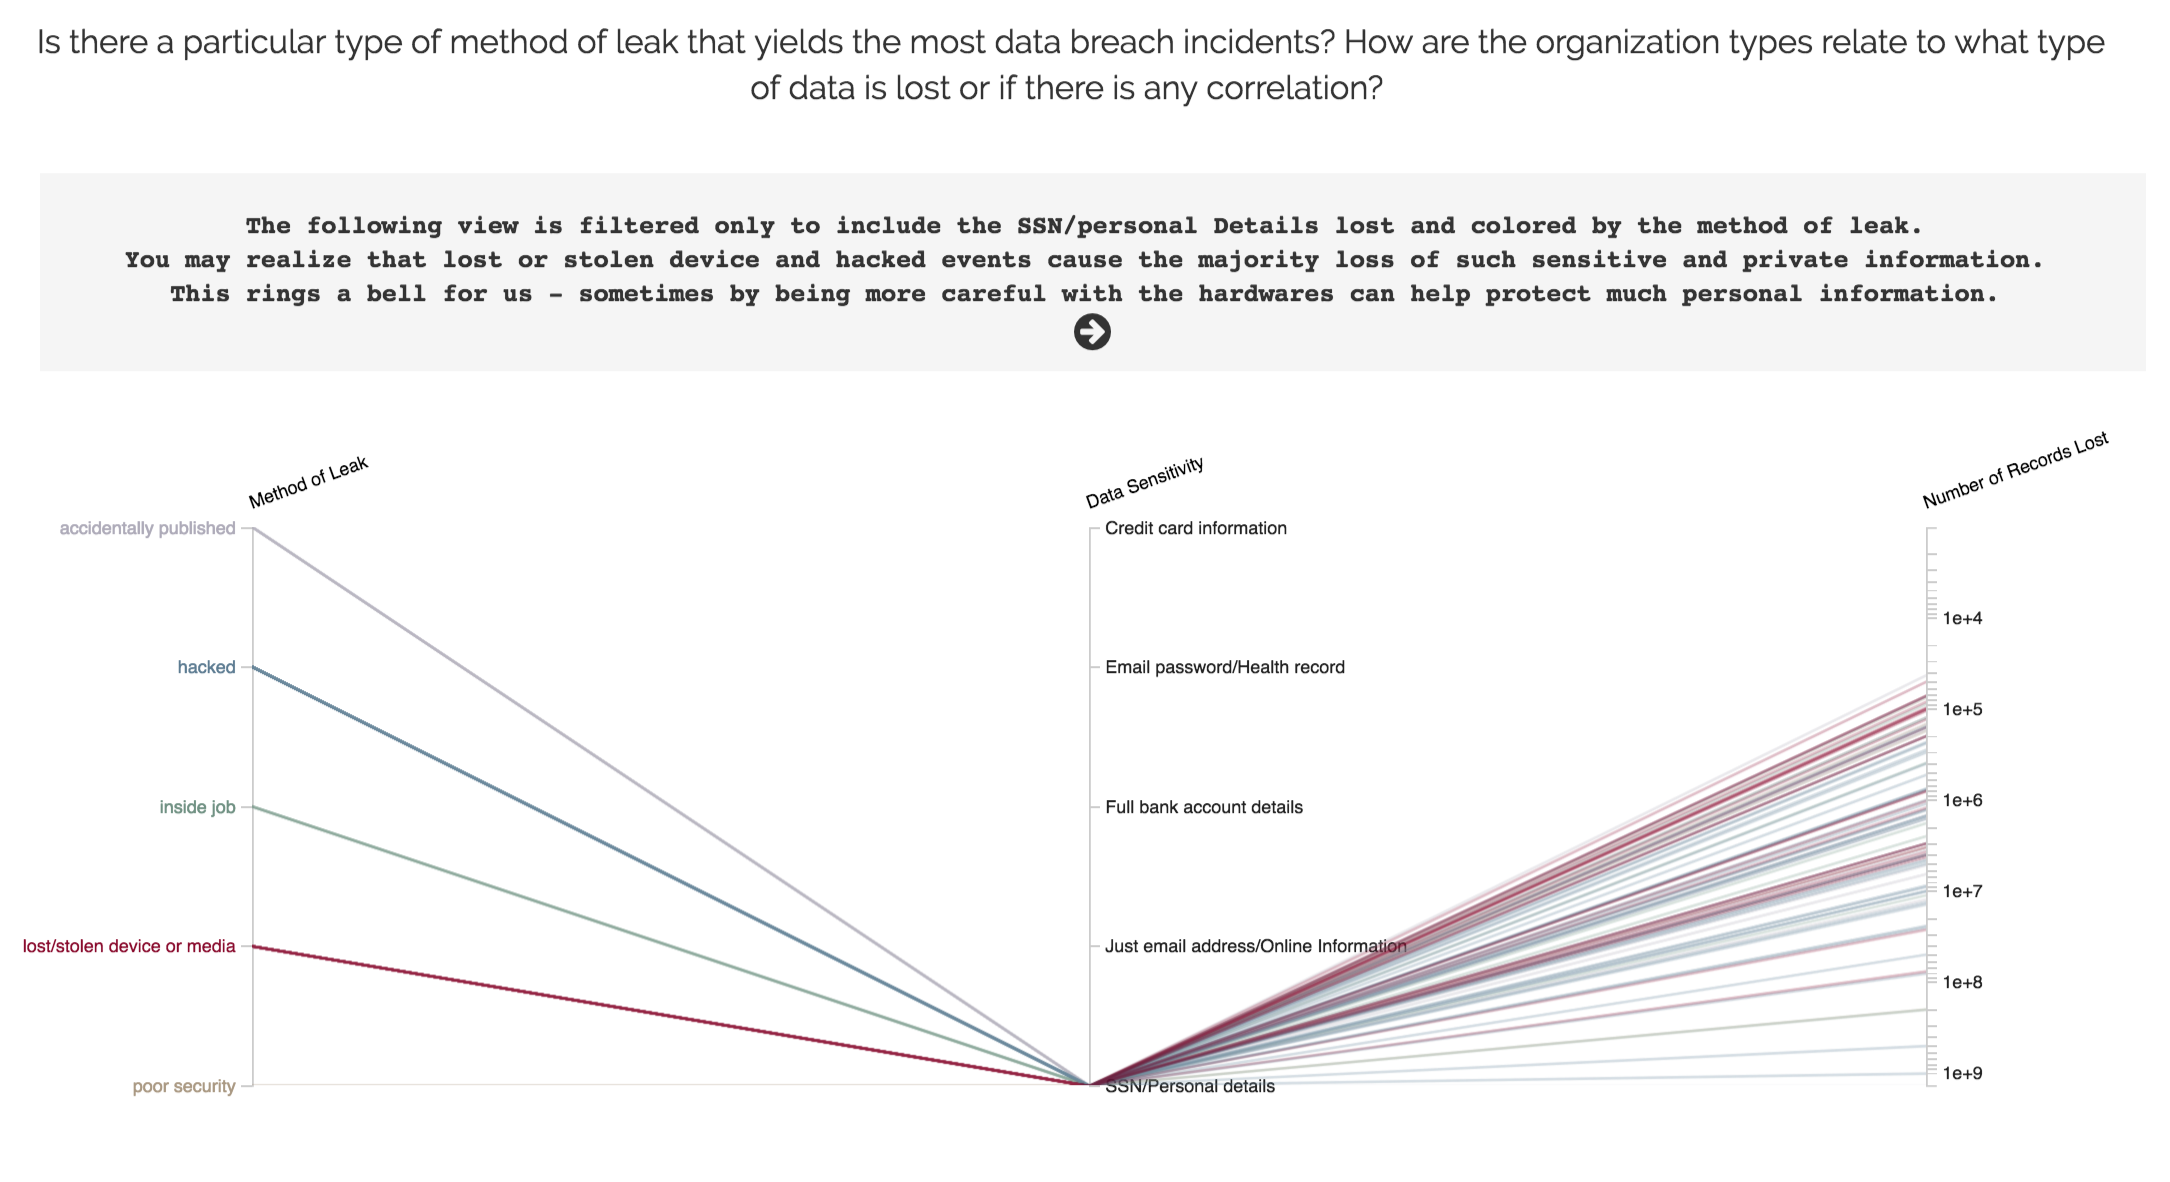
The changes we made mainly lie in the animation. In our testing iterations, we received some feedback regarding this graph being too cluttered without a key message. Some also reflected that they were not sure how to use the visualization. Therefore, we decided to adopt a more guided approach. The grey panel in the middle first show instructions (view 1). The viewer is then prompted to click. Upon clicking, the visualization appear with the first default view (view 2), which is meant to show a specific message. The accompanying description and more instruction also appear in the grey panel. We decided to provide 2 default views (view 2 and view 3). Finally, after yet another viewer click, the visualization is revealed in its entirety (view 4) to allow maximum interactivity and user exploration.
View 1
View 2
View 3
View 4
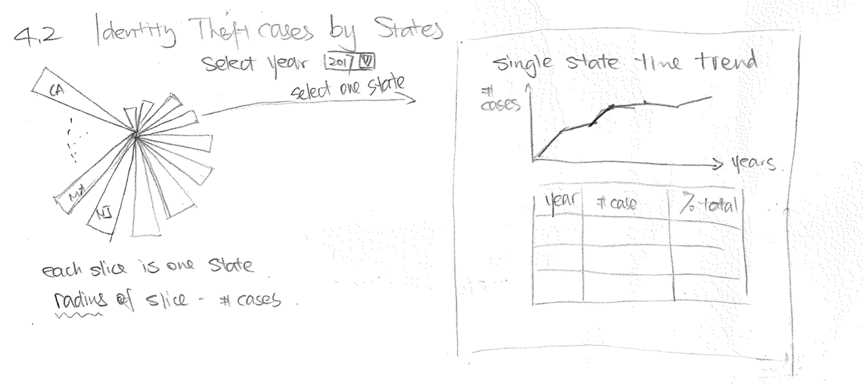
One main drawback of a polar area chart is that viewer would only be visually drawn to the most visible 3-4 slices.
Therefore, the polar area chart might not be the most suitable type of graph, especially given that there would have been
50 slices to represent 50 states.
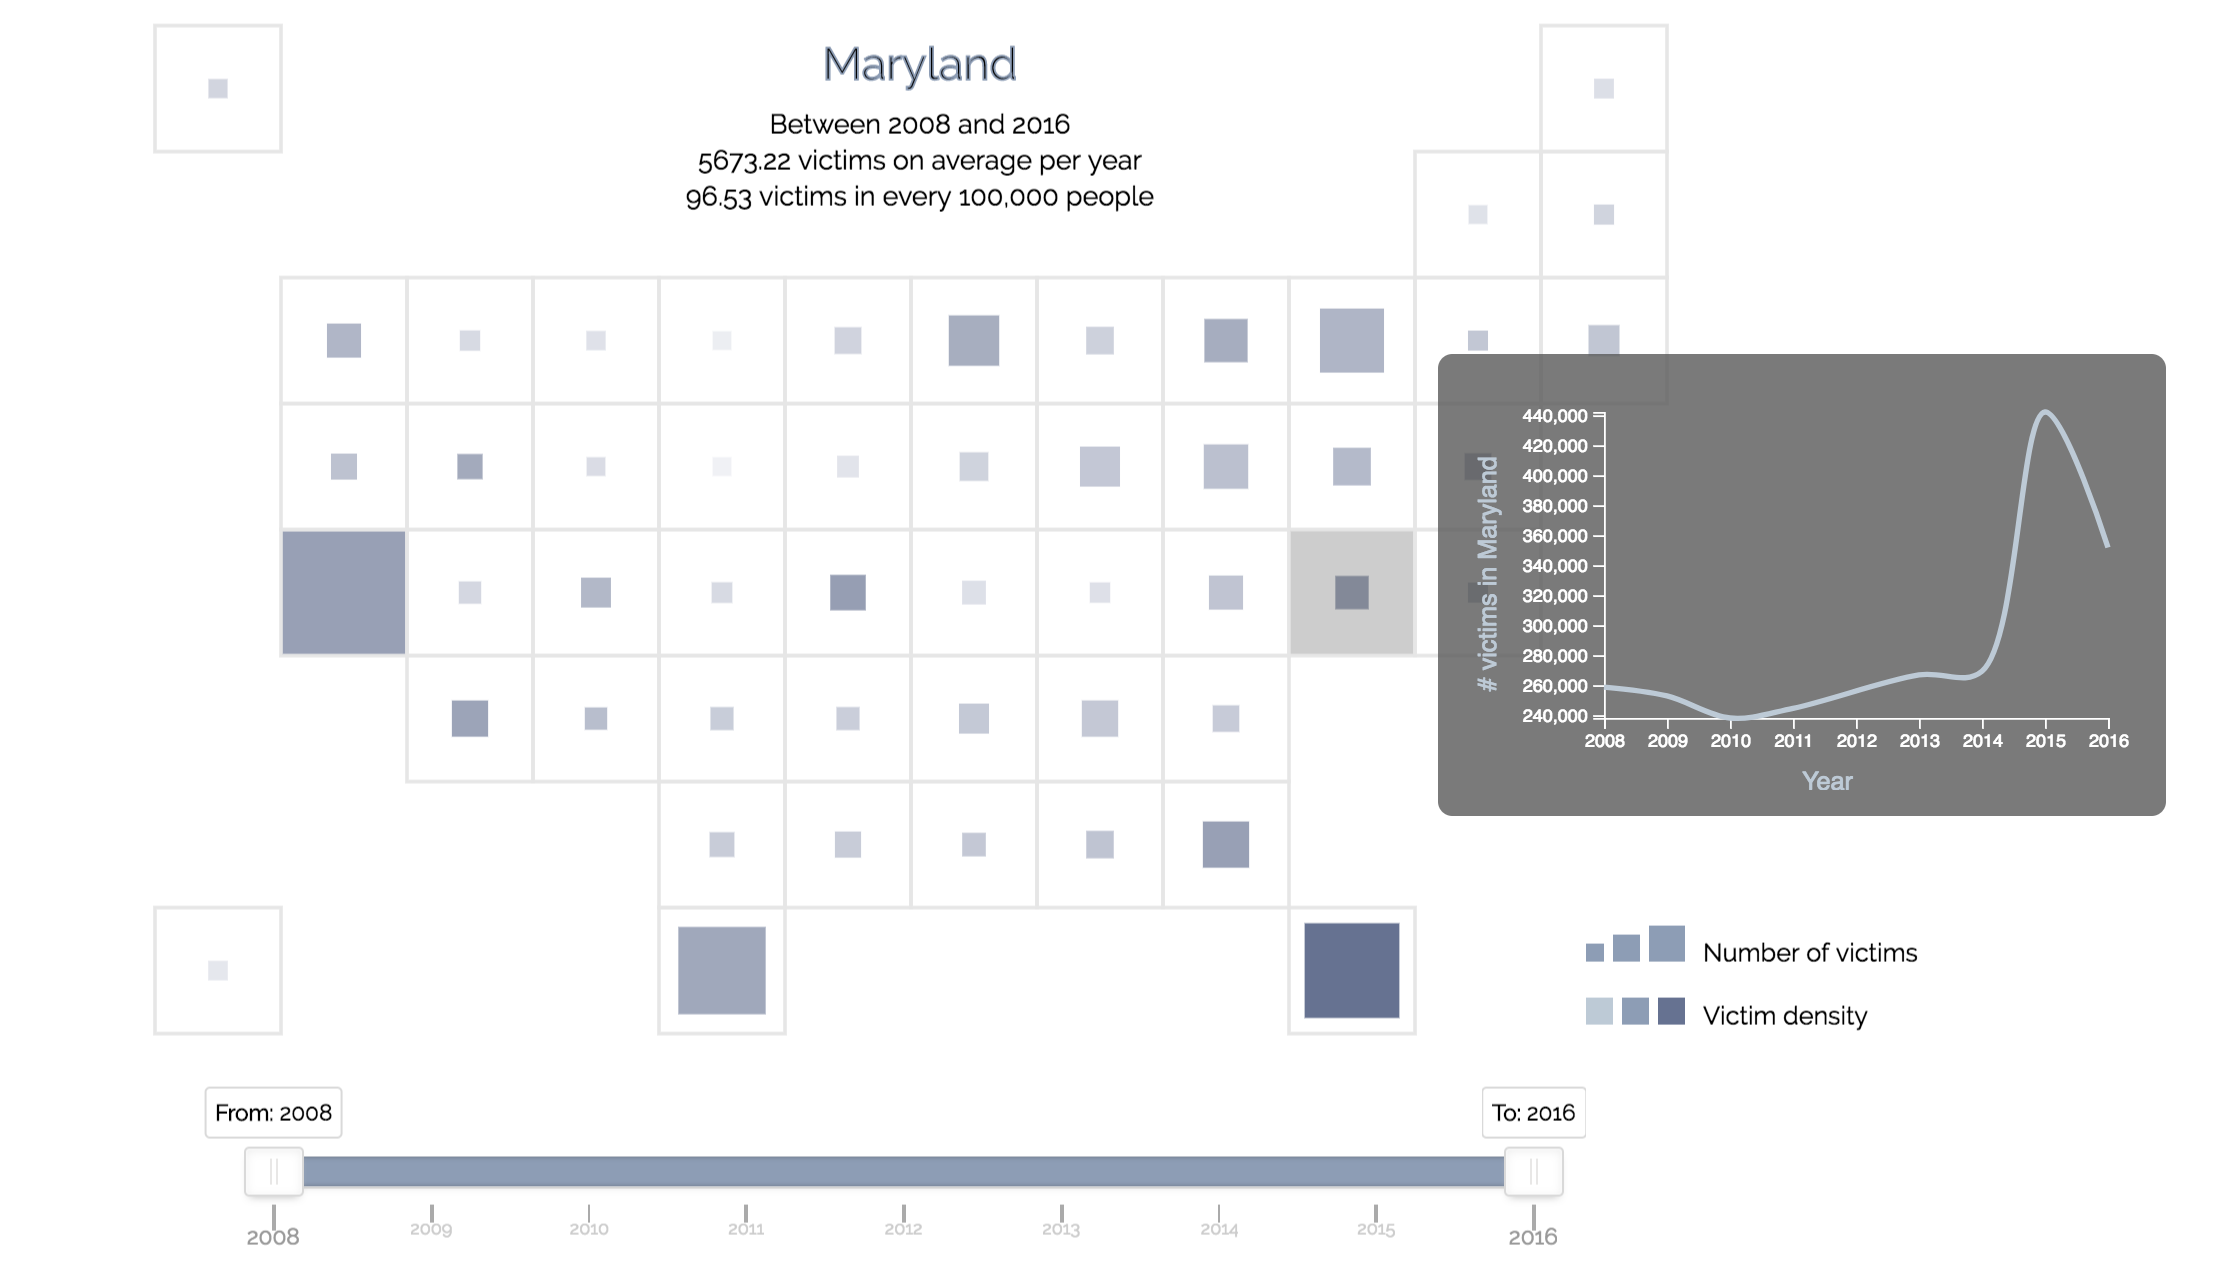
For this reason, we re-designed the visualization and used a modified version of a choropleth chart instead.
In this design, we represent each state not based on its actual geographical shape but squares with uniform areas.
This removes the lie factor that often is associated with choropleths.
By clicking on to each area, a line chart and a table corresponding to the state would be displayed to the right of the map to show the trend over the years for the selected state.
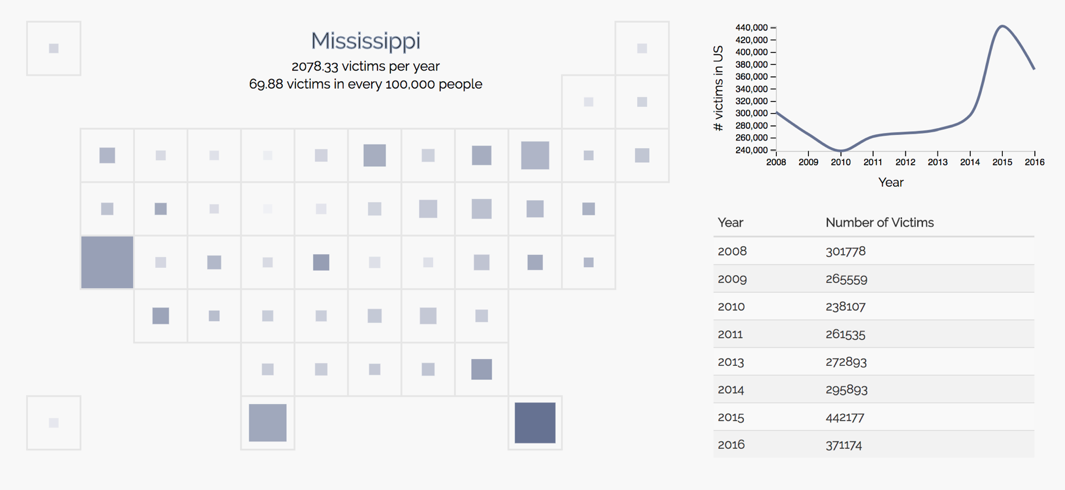
Having implemented the second design, we realized that having a map, a line chart and a table on the same page is a bit overwhelming visually. The line chart and table also served the same purpose. Therefore, we decided to implement the line chart as a tooltip, appearing on mouseover, and remove the table altogether. This created a much cleaner view that allows the user to focus on the spatial distribution first, and then drill down to temporal distribution of specific states.
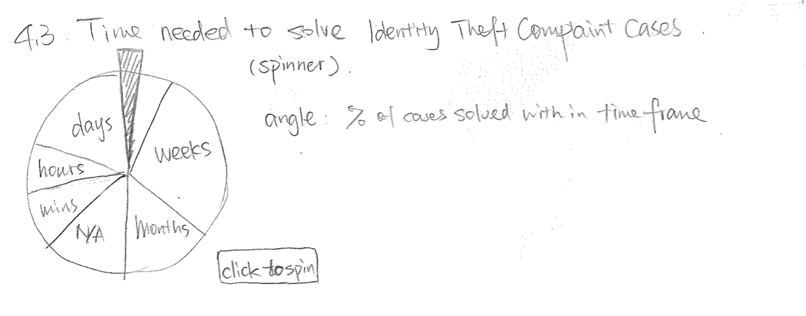
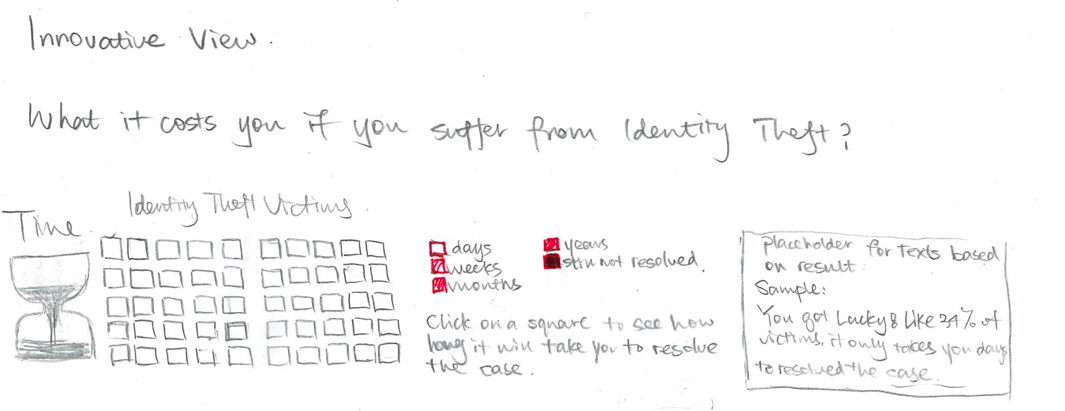
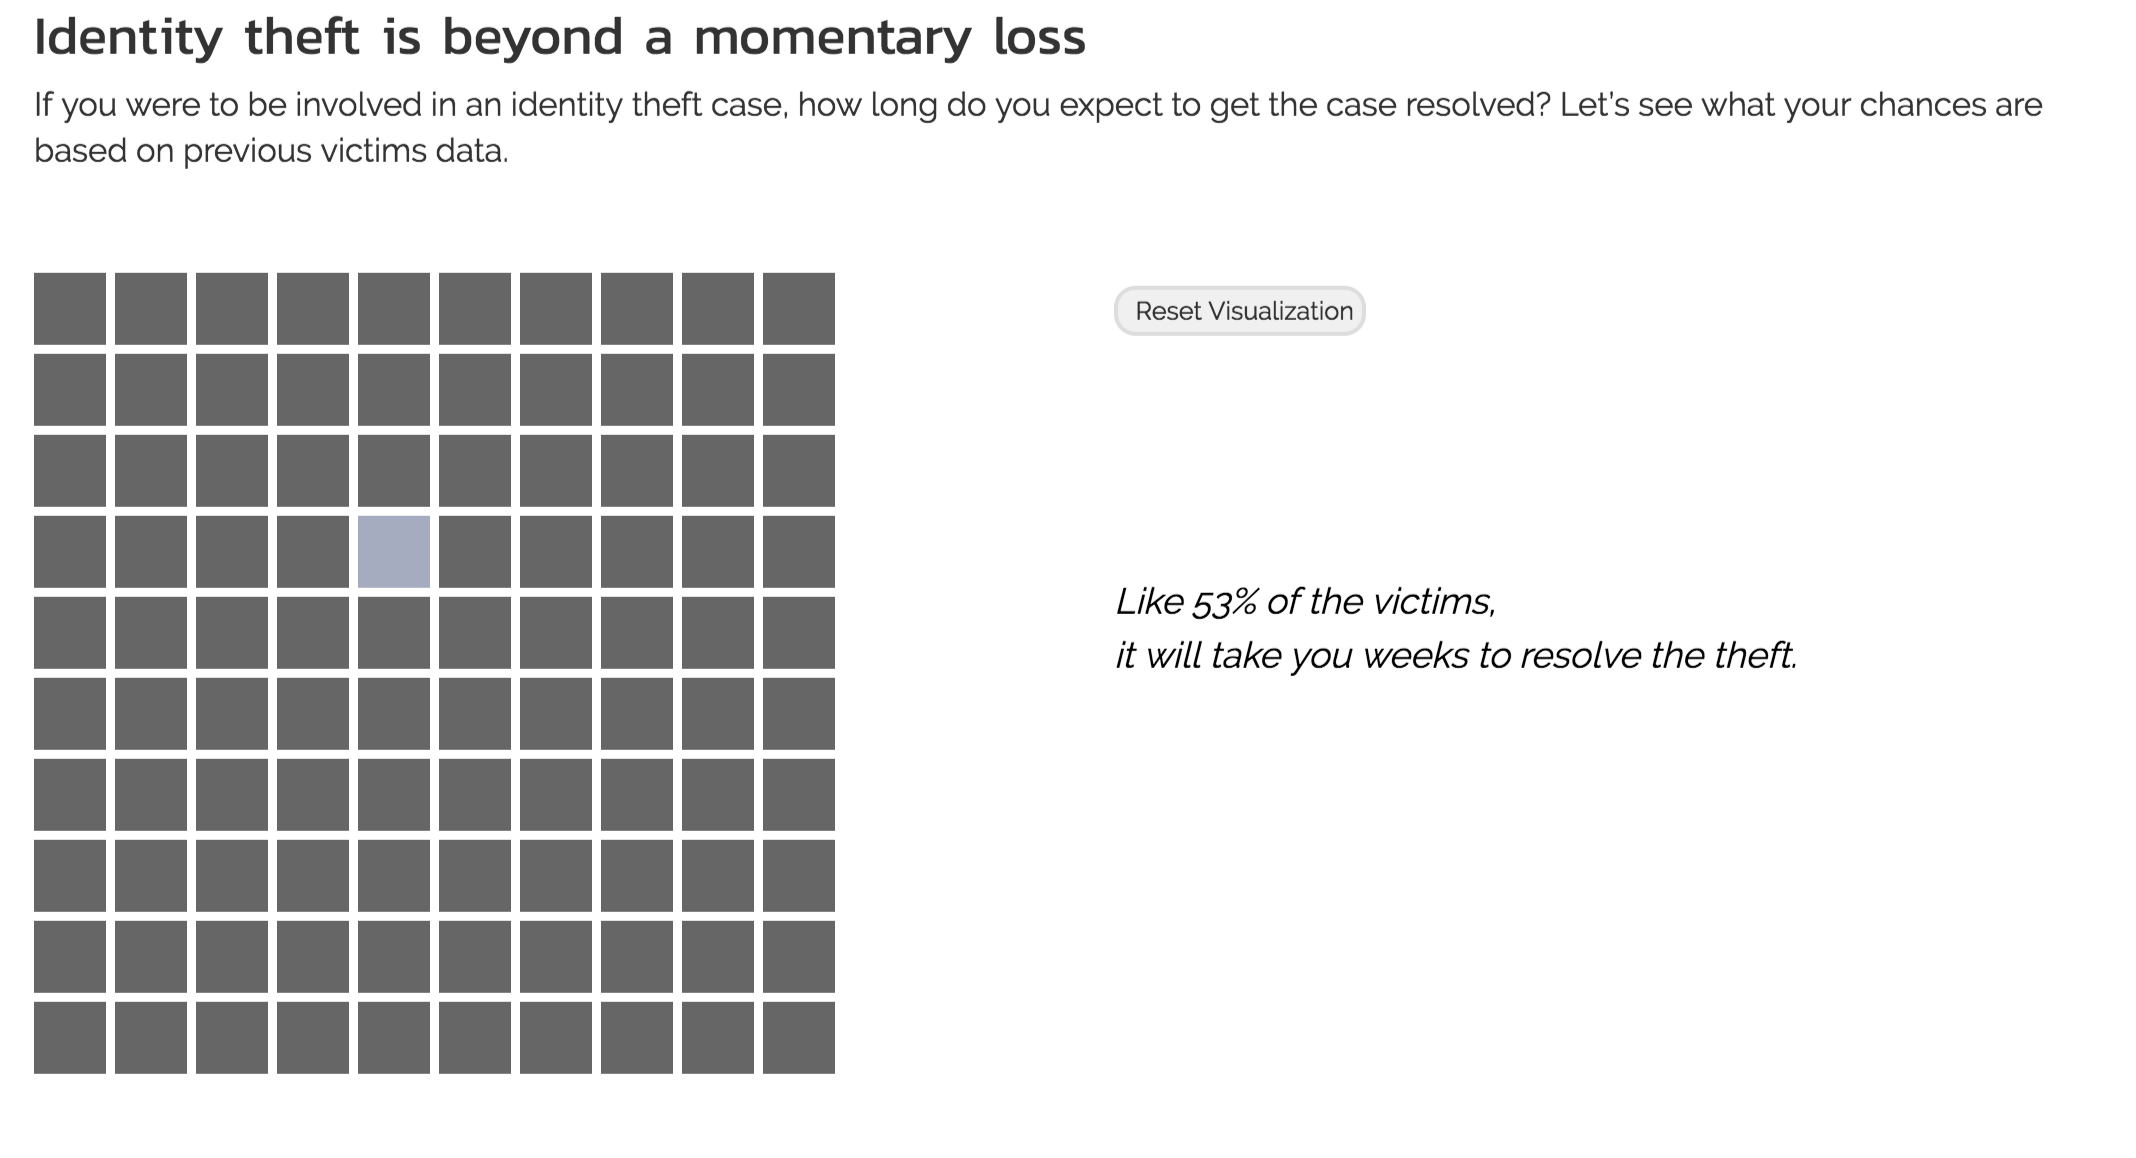
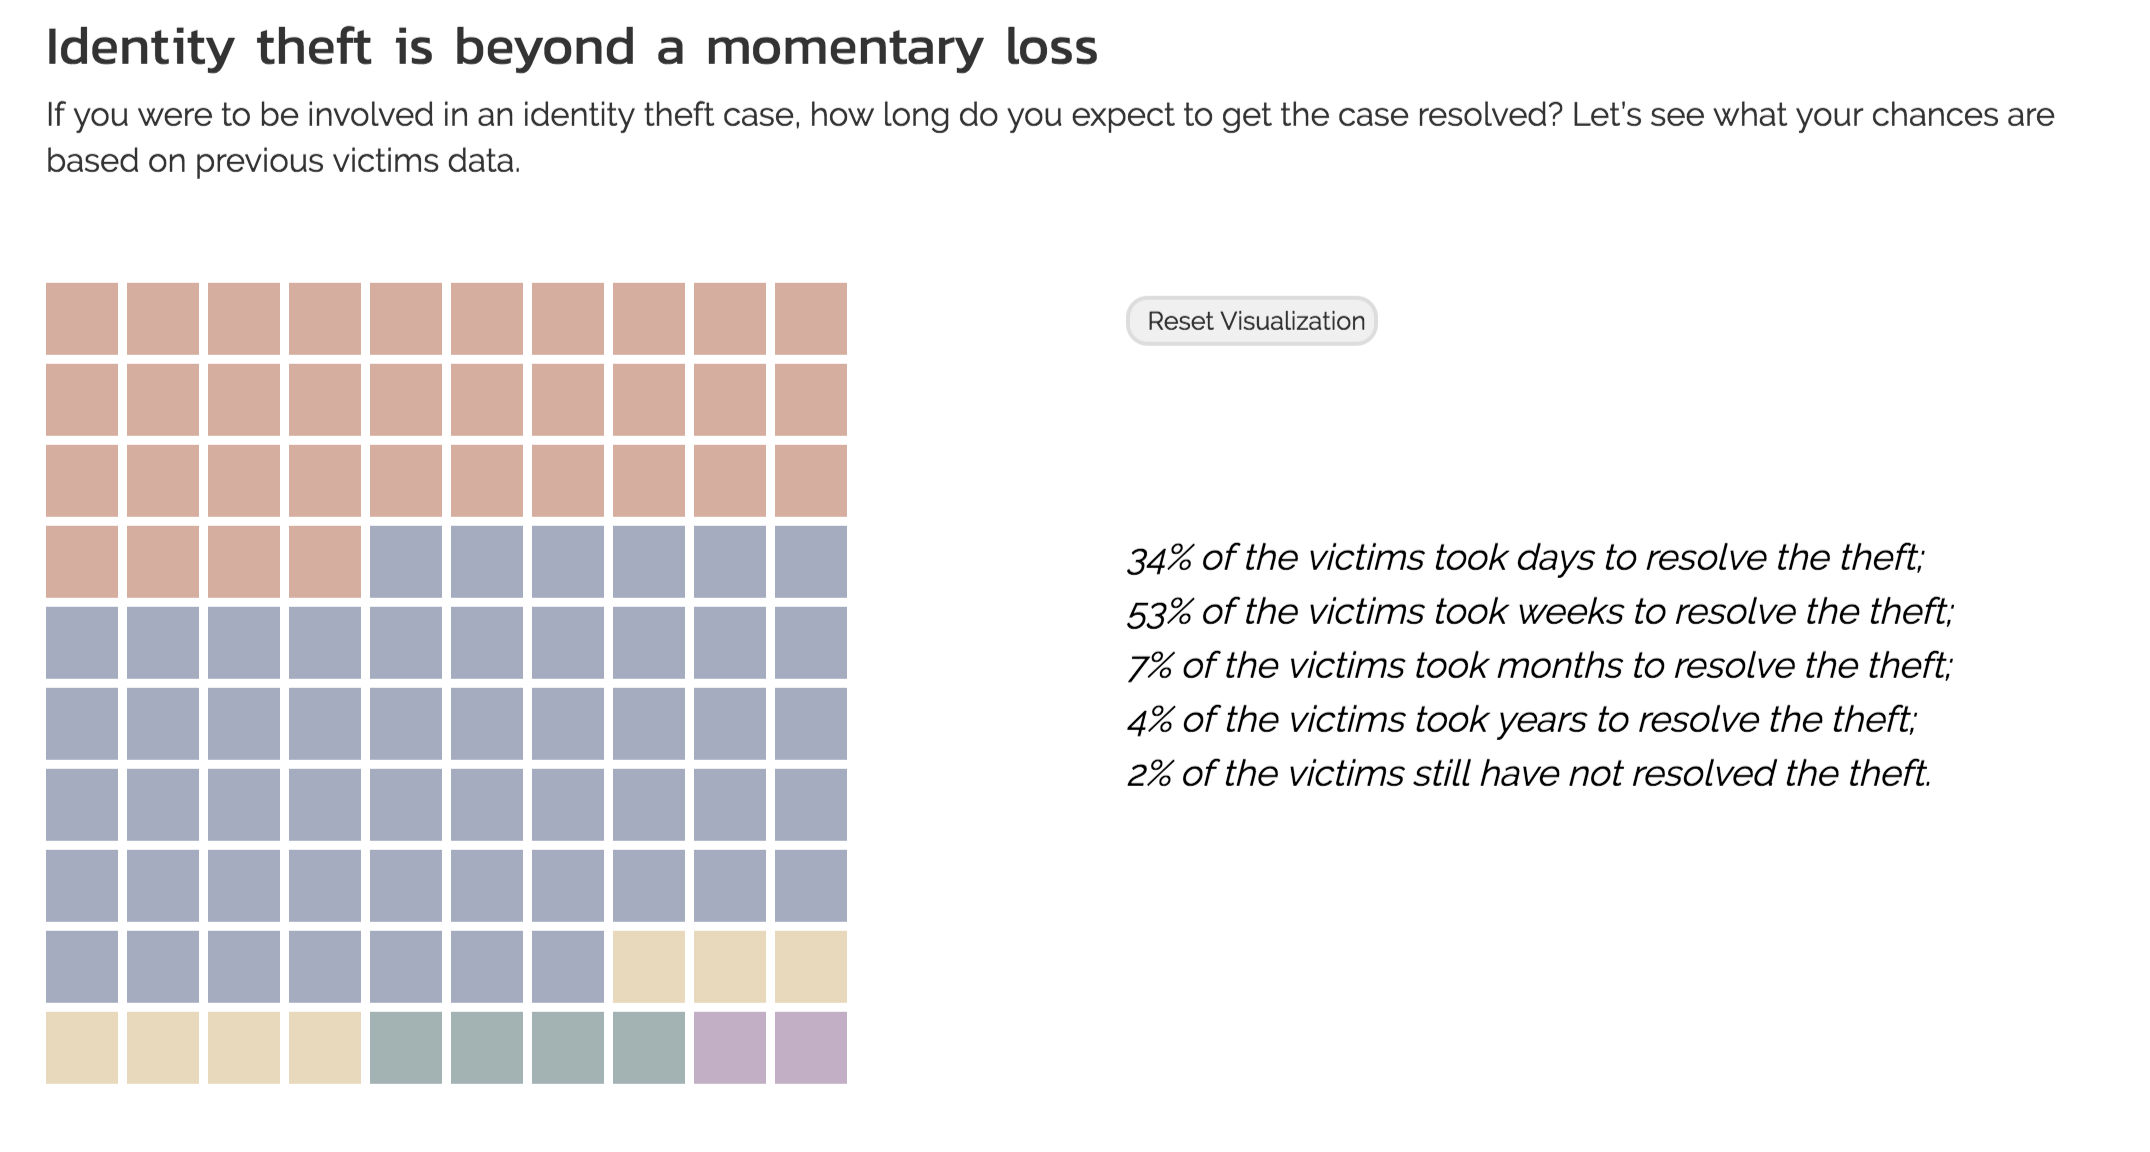
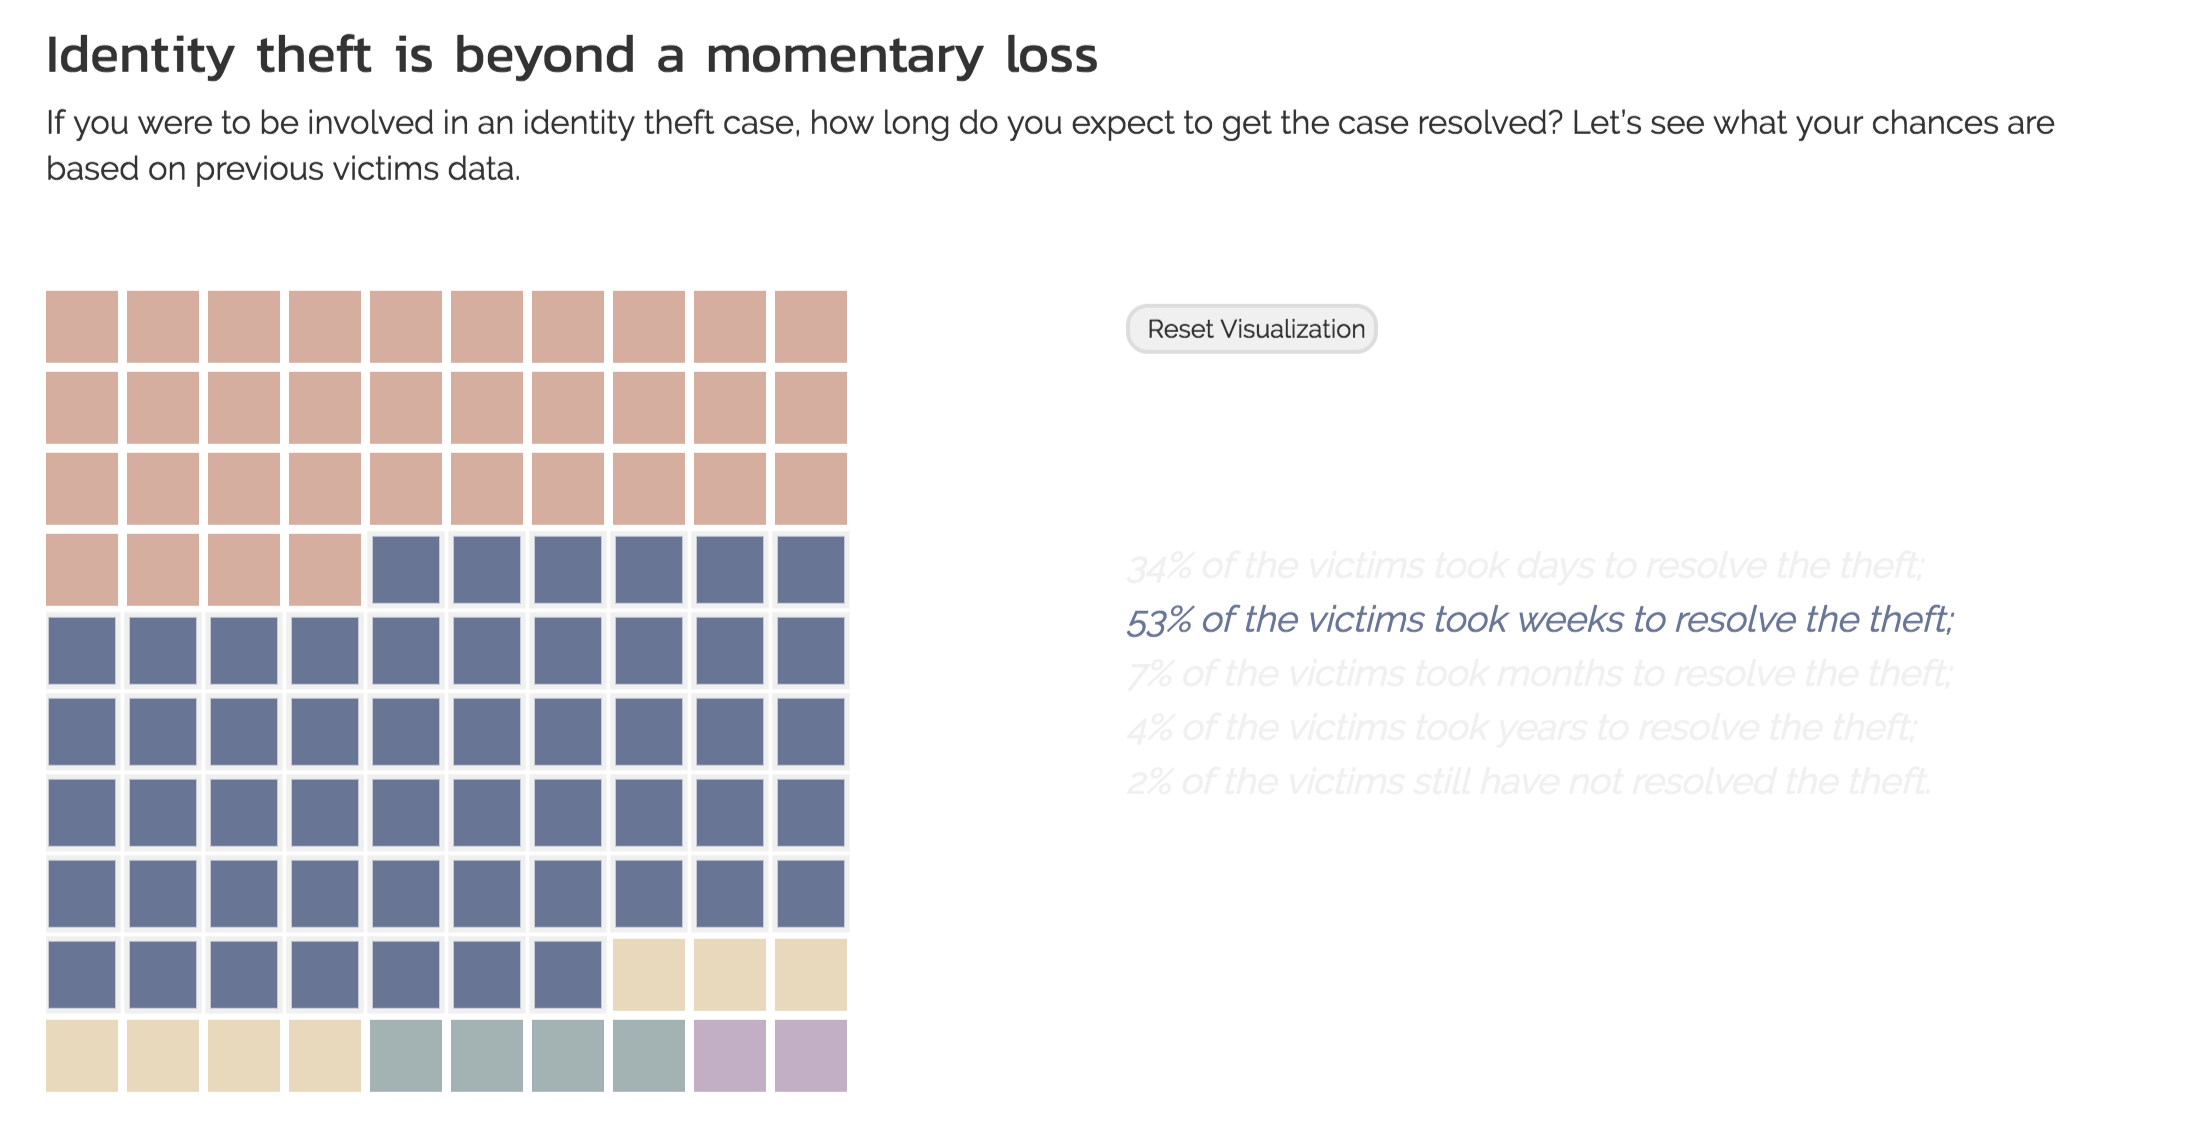
The main point of this visualization is to show the distribution of the time needed to resolve identity theft cases. To avoid ending the project with a rather conventional form of visualization, we wanted to capture audience interest by implementing an interactive/game-like visualization that contain some randomness.
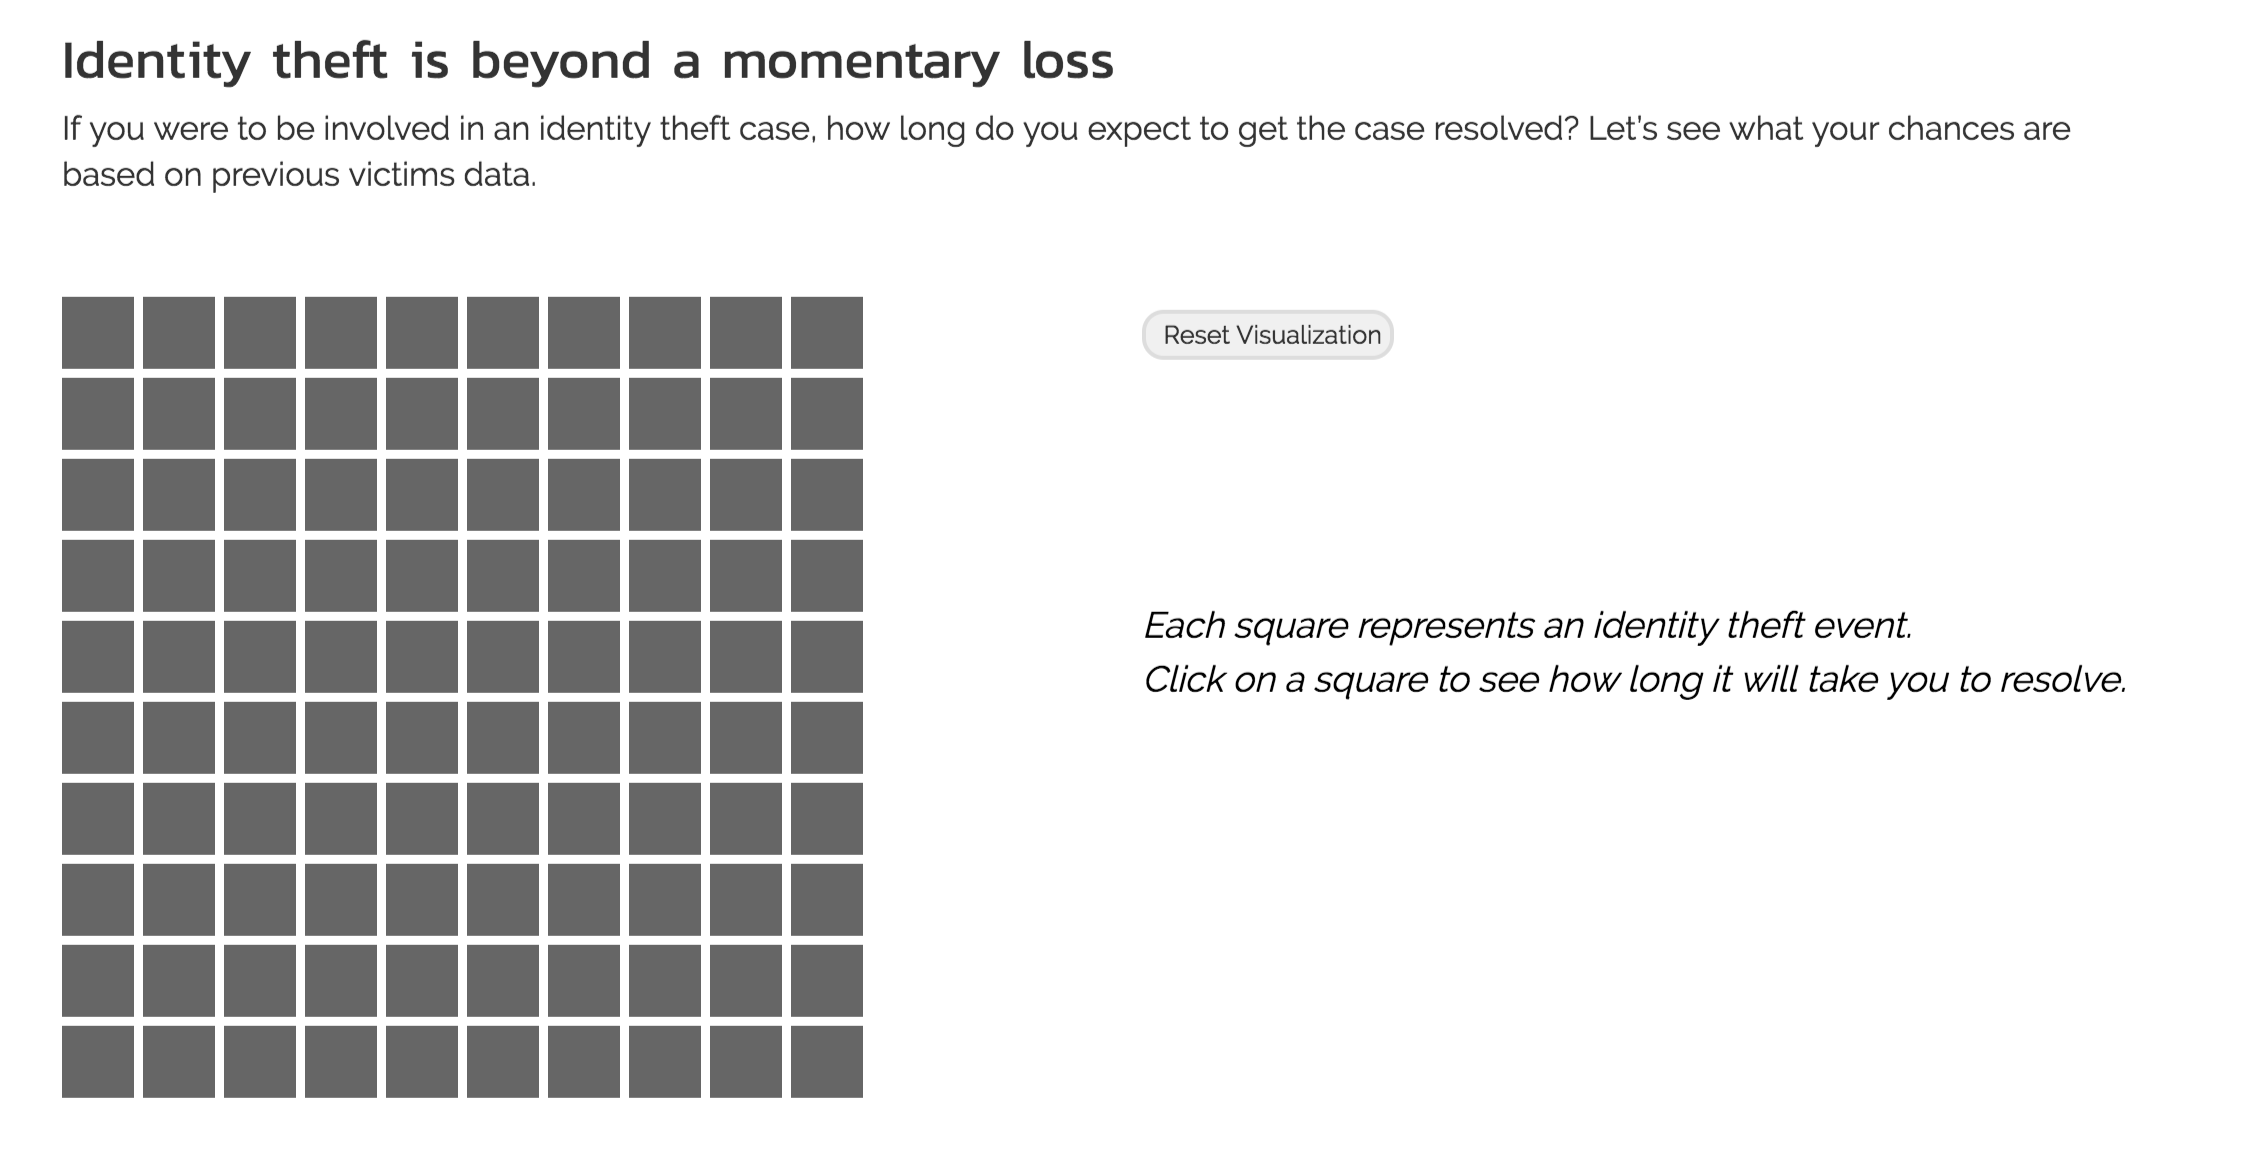
Since the dart visualization had been implemented in previous projects, we felt that it was best for us to come up with an original design that could end the project on a high note. After consulting with our TF, Zona, the idea that we finally settled on was a grid of squares where the user would be prompted to click. The click would then trigger a series of animation to reveal first a color that represents a category of time spent on resolving identity theft followed by the whole distribution. The first color is randomly chosen based on the distribution of previous victims data.
The actual implementation is shown below.
View 1
View 2
View 3
View 4
The work load of this project was split evenly across team members, and we were in constant communication to make sure everyone was on the same page and agreed to the designs. While everyone had a fair chunk of all aspects of the project (from web design to implementing visualizations), each member also had focus areas, and they are shown below:
| Member | Role |
|---|---|
| Michelle |
Project organization (github repo, overall website design) Evaluation of project targeting Design master |
| Cindy | Drawing of sketches and organization of visualization/interaction ideas Implementation of website animations Face of the project (presentation and screencast voice-over) |
| Ziqi | Maintenance of the process book Preprocessing of the data Code master |
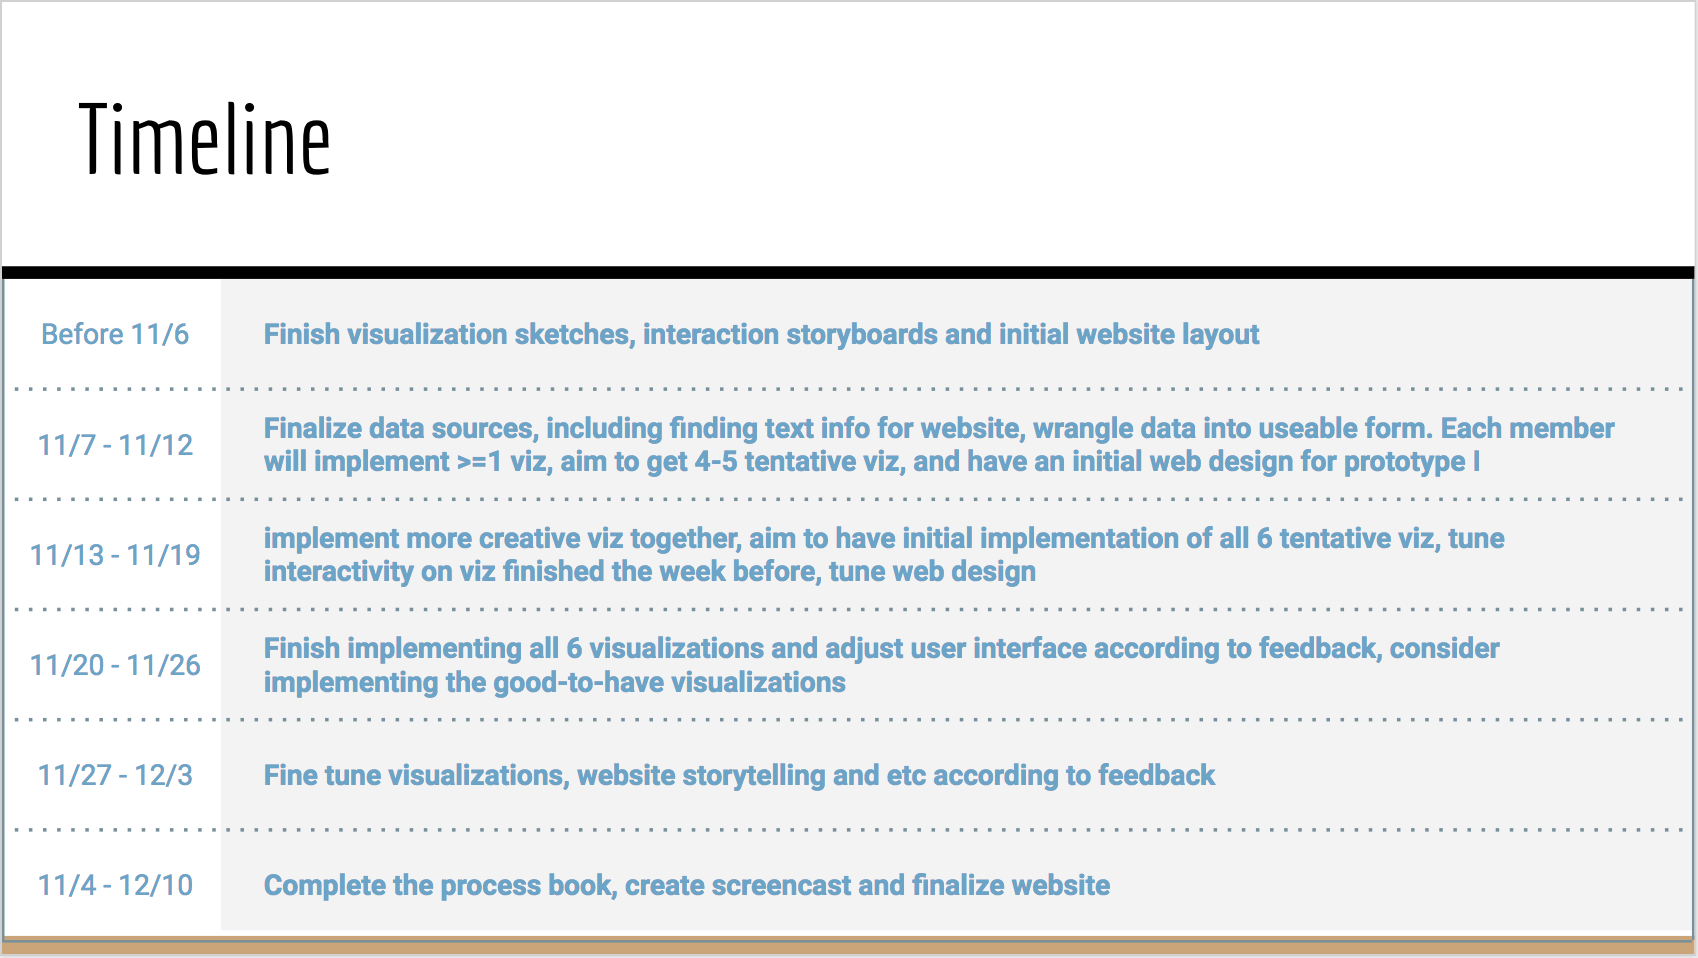
We roughly followed the time line below:
We hope that you have not only enjoyed our interactive visualizations but also learned something interesting and practical about protecting your personal cyber space. It has been tremendously fun to apply what we've learned in CS171 and to explore beyond what was taught. Creating complex interactive visualizations and designing both user-friendly and visually appealing website were by no means easy tasks, but it was a great learning journey, and we feel very satisfied with what we've achieved as a team.